3 Item and Test Development
Chapter 3 of the 2014–2015 Technical Manual—Year-End Model (Dynamic Learning Maps Consortium, 2016b) describes item and test development procedures. This chapter provides an overview of updates to item and test development for the 2019–2020 academic year. The first portion of the chapter provides an overview of revisions to the year-end assessment model blueprints, 2019–2020 item writers’ characteristics, followed by the 2019–2020 external review of items, testlets, and texts based on criteria centered around content, bias, and accessibility. The next portion of the chapter describes the pool of operational and field test testlets available for administration during 2019–2020.
For a complete description of item and test development for DLM assessments, including information on the use of evidence-centered design and Universal Design for Learning in the creation of concept maps to guide test development; external review of content; and information on the pool of items available for the pilot, field tests, and 2014–2015 administration, see the 2014–2015 Technical Manual—Year-End Model (Dynamic Learning Maps Consortium, 2016b).
3.1 Items and Testlets
This section describes information pertaining to items and testlets administered as part of the DLM assessment system, including a description of blueprint changes and a brief summary of item writer demographics and duties for the 2019–2020 year. For a complete summary of item and testlet development procedures that began in 2014–2015 and were implemented through 2019–2020, see Chapter 3 of the 2014–2015 Technical Manual—Year-End Model (Dynamic Learning Maps Consortium, 2016b).
3.1.1 Blueprint Updates
Discussions began in the summer of 2016 with states adopting the year-end (YE) assessment model about the need to review and revise the YE blueprints. At the December 2016 governance meeting, the consortium governance board agreed that a reduction in the number of Essential Elements (EEs) on the English language arts (ELA) and mathematics YE blueprints was necessary. They also agreed to change test specifications to increase the number of items that assess a single EE, as the existing testlets only measured one to two items per EE. These changes would allow reporting of fine-grained information in the Learning Profile. Given the lower-than-originally-expected testing times, state partners agreed to raise the current maximum of 30 items administered per grade and subject.
3.1.1.1 Blueprint Revisions Process
The revision process began with a content review of the original YE blueprints and a comparison to the instructionally embedded model blueprints. Three principles guided the selection of EEs for the revisions and were part of the original development of DLM blueprints in 2014. Below, “goal” or “goals” describe outcomes related to each principle that will meet the guidelines stated above.
Principle #1: The blueprint should have broad coverage of academic content as described by the EEs. The goals related to this principle are to provide appropriate breadth of content coverage of EEs within each grade and subject, select EEs for the blueprint that represent useful and valuable content for students, keep proportional coverage of claims and/or conceptual areas close to or identical to the current blueprint, and select a number of EEs in each grade that is more consistent with the number of EEs required in the instructionally embedded model blueprint.
Principle #2: The blueprint should emphasize connections in skills and understanding from grade to grade. The goals related to this principle are to select EEs in each grade that are conceptually related to EEs in later grades and use the learning map model structure to inform grade-to-grade decisions to provide a connected, continuous delivery of content across all grades.
Principle #3: The revised blueprint should allow for a testlet design where each EE is assessed by 3-5 items for a total of 35-45 items in each content area in each grade. The goal related to this principle is to reduce the number of EEs to increase the number of items per EE, supporting the delivery of fine-grained mastery information without exceeding the consortium’s maximum allowable assessment length.
3.1.1.2 Overview of Blueprint Revision
This section provides a content overview of the revisions to the DLM YE blueprints in ELA and mathematics for grades 3 through 8 and high school. The revised blueprints prioritize a set of EEs using a set of rationale categories to provide appropriate breadth and depth of content coverage in each discipline. The rationale categories used in the development of this version of the YE blueprints are:
Category 1: Include EEs that introduce or extend critical academic skills to form particular learning pathways in a topic/subject across grades. The EEs under Category 1 introduce an important academic skill, are a crucial turning point in a topic/subject, combine multiple critical academic skills, and expand on critical academic skills acquired in a previous grade.
Category 2: Include EEs that maintain representative conceptual area or content coverage. The EEs under Category 2 maintain complete coverage of all conceptual areas, provide equivalent coverage, across grades, of similar academic skills in each conceptual area, are the initial or last EE on a topic/subject across grades, address unique skills, and have few critical linkage level skills shared with other EEs.
Category 3: Exclude EEs that have a high degree of similarity with another EE that will remain on the revised blueprints, within or across grades. The EEs under Category 3 provide preferential coverage of the same academic skills in only one conceptual area and do not significantly expand on academic skills acquired in one or more of the surrounding grades,
Category 4: Exclude EEs that allow for additional coverage or more learning opportunities to critical academic skills.
Table 3.1 lists all the EEs approved for the original and revised YE ELA blueprints, and Table 3.2 lists all the EEs approved for the original and revised YE mathematics blueprints.
|
Original Blueprint
|
Revised Blueprint
|
|||||||||||
|---|---|---|---|---|---|---|---|---|---|---|---|---|
|
Grade
|
Conceptual Area
|
Total
|
Conceptual Area
|
Total
|
||||||||
| C1.1 | C1.2 | C1.3 | C2.1 | C2.2 | C1.1 | C1.2 | C1.3 | C2.1 | C2.2 | |||
| 3 | 7 | 5 | 2 | 2 | 0 | 16 | 4 | 3 | 1 | 2 | 0 | 10 |
| 4 | 7 | 6 | 1 | 3 | 0 | 17 | 3 | 4 | 1 | 3 | 0 | 11 |
| 5 | 3 | 8 | 4 | 2 | 0 | 17 | 1 | 5 | 2 | 2 | 0 | 10 |
| 6 | 1 | 10 | 3 | 2 | 0 | 16 | 1 | 6 | 1 | 3 | 0 | 11 |
| 7 | 1 | 8 | 4 | 5 | 0 | 18 | 1 | 4 | 3 | 5 | 0 | 13 |
| 8 | 0 | 9 | 3 | 5 | 0 | 17 | 0 | 6 | 2 | 5 | 0 | 13 |
| 9 | 0 | 9 | 3 | 3 | 2 | 17 | 0 | 5 | 3 | 4 | 2 | 14 |
| 10 | 0 | 9 | 3 | 3 | 2 | 17 | 0 | 5 | 3 | 4 | 2 | 14 |
| 11 | 0 | 7 | 4 | 4 | 2 | 17 | 0 | 5 | 3 | 4 | 2 | 14 |
| Note. The same essential elements are tested in grades 9 and 10. | ||||||||||||
|
Original Blueprint
|
Revised Blueprint
|
|||||||||||||||||||
|---|---|---|---|---|---|---|---|---|---|---|---|---|---|---|---|---|---|---|---|---|
|
Grade
|
Conceptual Area
|
Total
|
Conceptual Area
|
Total
|
||||||||||||||||
| C1.1 | C1.2 | C1.3 | C2.1 | C2.2 | C3.1 | C3.2 | C4.1 | C4.2 | C1.1 | C1.2 | C1.3 | C2.1 | C2.2 | C3.1 | C3.2 | C4.1 | C4.2 | |||
| 3 | 3 | 0 | 1 | 0 | 1 | 2 | 1 | 2 | 1 | 11 | 2 | 0 | 1 | 0 | 1 | 1 | 1 | 1 | 1 | 8 |
| 4 | 2 | 2 | 1 | 3 | 1 | 3 | 1 | 2 | 1 | 16 | 1 | 0 | 1 | 1 | 1 | 3 | 0 | 0 | 1 | 8 |
| 5 | 2 | 3 | 2 | 2 | 1 | 3 | 1 | 0 | 1 | 15 | 1 | 2 | 1 | 2 | 1 | 0 | 1 | 0 | 0 | 8 |
| 6 | 1 | 2 | 2 | 0 | 2 | 0 | 1 | 3 | 0 | 11 | 0 | 2 | 0 | 0 | 2 | 0 | 1 | 2 | 0 | 7 |
| 7 | 2 | 1 | 3 | 3 | 1 | 0 | 2 | 1 | 1 | 14 | 1 | 0 | 3 | 1 | 1 | 0 | 0 | 1 | 0 | 7 |
| 8 | 1 | 1 | 2 | 4 | 1 | 0 | 1 | 1 | 3 | 14 | 1 | 0 | 1 | 1 | 1 | 0 | 1 | 1 | 2 | 8 |
| 9 | 0 | 0 | 3 | 2 | 1 | 0 | 0 | 2 | 0 | 8 | 0 | 0 | 3 | 2 | 1 | 0 | 0 | 2 | 0 | 7 |
| 10 | 0 | 0 | 1 | 1 | 0 | 1 | 2 | 2 | 2 | 9 | 0 | 0 | 1 | 1 | 0 | 1 | 2 | 1 | 2 | 8 |
| 11 | 0 | 0 | 2 | 1 | 0 | 0 | 1 | 0 | 5 | 9 | 0 | 0 | 2 | 1 | 0 | 0 | 1 | 0 | 2 | 6 |
In both subjects, test development teams determined which EEs to exclude from the revised blueprint, while maintaining the three guiding principles. Some reasons for excluding EEs from the revised blueprint were a high degree of node overlap with other EEs included in the blueprint, similar skills to other EEs included in the blueprint, to target EEs representing skills that receive less coverage in the blueprint than other skills, to allow for additional coverage to be provided to the critical foundational nodes associated with other EEs included in the blueprint, or it does not significantly extend upon the skills represented in the standards in the surrounding grades.
EEs were included or excluded from the revised blueprints based on the four categories listed above. Table 3.3 shows how many EEs from the original YE blueprint in ELA and mathematics were either included or excluded from the revised blueprint per category.
| Category | English language arts | Mathematics |
|---|---|---|
| 1 (Included) | 40 | 11 |
| 2 (Included) | 54 | 56 |
| 3 (Excluded) | 35 | 20 |
| 4 (Excluded) | 6 | 20 |
| Note. Category 1 and 2 for English language arts do not add up to the sum of the ELA EEs in Table 3.3, because grades 9 and 10 share the same EEs and two EEs were added that were not on the original blueprint. |
3.1.1.3 Breadth and Depth of Node Coverage
This section describes how the revisions to the DLM YE model assessment blueprints maintain a proportional coverage of nodes from the DLM maps compared to the original YE blueprints. The revision provided consistent breadth and depth of node coverage for the grade-level EEs within each subject.
Tables 3.4 and 3.5 present the node coverage for the revised YE model blueprints compared to the original blueprints. Test development team revisions retained coverage of between 57–79% of nodes in ELA and 50–99% of nodes in mathematics outright. Of the nodes that were not retained, between 8–21% in ELA and 0–55% in mathematics were covered in other grades. The revised blueprints only reduced node coverage by between 2–8 nodes in ELA and 0–17 nodes in mathematics per grade.
| Grade | Nodes in Original Blueprint (n) | Nodes in Revised Blueprint (n) | Nodes Retained (%) | Uncovered Nodes in Grade Level (n) | Nodes Covered in Other Grades (n) | Uncovered Nodes (n) | Uncovered Nodes (%) |
|---|---|---|---|---|---|---|---|
| 3 | 54 | 38 | 70.4 | 16 | 10 | 6 | 11.1 |
| 4 | 53 | 36 | 67.9 | 17 | 9 | 8 | 15.1 |
| 5 | 61 | 35 | 57.4 | 26 | 21 | 5 | 8.2 |
| 6 | 64 | 40 | 62.5 | 25 | 17 | 8 | 12.5 |
| 7 | 61 | 40 | 65.6 | 21 | 17 | 4 | 6.6 |
| 8 | 53 | 40 | 75.5 | 13 | 11 | 2 | 3.8 |
| 9–10 | 62 | 42 | 67.7 | 20 | 16 | 4 | 6.5 |
| 11–12 | 53 | 42 | 79.2 | 11 | 8 | 3 | 5.7 |
| Note. English language arts essential elements for high school are organized into two grade bands (9–12 and 11–12) instead of individual grades. |
| Grade | Nodes in Original Blueprint (n) | Nodes in Revised Blueprint (n) | Nodes Retained (%) | Uncovered Nodes in Grade Level (n) | Nodes Covered in Other Grades (n) | Uncovered Nodes (n) | Uncovered Nodes (%) |
|---|---|---|---|---|---|---|---|
| 3 | 99 | 83 | 83.8 | 16 | 16 | 0 | 0.0 |
| 4 | 144 | 91 | 63.2 | 53 | 47 | 6 | 4.2 |
| 5 | 143 | 71 | 49.7 | 72 | 55 | 17 | 11.9 |
| 6 | 98 | 66 | 67.3 | 32 | 29 | 3 | 3.1 |
| 7 | 133 | 76 | 57.1 | 57 | 50 | 7 | 5.3 |
| 8 | 115 | 71 | 61.7 | 44 | 27 | 17 | 14.8 |
| 9 | 92 | 85 | 92.4 | 7 | 5 | 2 | 2.2 |
| 10 | 72 | 71 | 98.6 | 1 | 0 | 1 | 1.4 |
| 11 | 76 | 61 | 80.3 | 15 | 4 | 11 | 14.5 |
| Note. Since the mathematics essential elements for high school are not divided into grades, the high school EEs are organized into three grade-level integrated mathematics courses: Math 9, Math 10, and Math 11. |
In summary, the revised blueprints provide a connected, continuous delivery of content across all grades. Furthermore, the revisions to the DLM YE model assessment blueprints allowed for an increase in the number of items covered in each EE while simultaneously collecting fine-grained student mastery information necessary to create informative and useful student reports.
3.1.1.4 Single-EE Testlets
In addition to adopting revised blueprints for ELA and mathematics, the consortium governance board decided to transition to administering testlets measuring a single Essential Element (EE), rather than the previously administered multi-EE testlets. The single-EE testlets are already administered by states adopting the instructionally embedded assessment model. Additionally, the optional instructionally embedded assessments available during fall are all single-EE testlets. For more information on single-EE testlets, see Chapter 3 of the 2014–2015 Technical Manual—Integrated Model (Dynamic Learning Maps Consortium, 2016a).
3.1.2 Item Writing
For the 2019–2020 year, items were written to replenish the pool of test content. The item writing process for 2019–2020 began with an on-site event in January 2020. Following this initial event, item writing continued remotely via a secure online platform until the end of June 2020. A single pool of item writers was trained to write single-Essential Element (EE) testlets to expand the operational pool.
A total of 266 single-EE testlets were written for English language arts (ELA) and 309 were written for mathematics.
3.1.2.1 Item Writers
An item writer survey was used to collect demographic information about the teachers and other professionals who were hired to write DLM testlets. In total, 41 item writers contributed to writing testlets for the 2019–2020 year, including 22 for mathematics and 19 for ELA. The median and range of years of teaching experience is shown in Table 3.6. The median years of experience was at least 12 years for item writers of both ELA and mathematics testlets in pre-K–12 and at least eight years for the special education subject area.
|
English language arts
|
Mathematics
|
|||
|---|---|---|---|---|
| Area | Median | Range | Median | Range |
| English Language Arts | 11.5 | 0–29 | 7.0 | 0–27 |
| Mathematics | 10.0 | 0–29 | 10.0 | 0–32 |
| Pre-K–12 | 15.0 | 0–39 | 12.0 | 0–37 |
| Special Education | 10.0 | 0–20 | 8.0 | 0–32 |
The level and types of degrees held by item writers are shown in Table 3.7 and Table 3.8, respectively. The 35 item writers who completed the demographics survey held at least a bachelor’s degree, with the most common field of study being other (n = 19; 54%), followed by education (n = 10; 29%). A majority (n = 31; 89%) also held a master’s degree, for which the most common field of study was special education (n = 13; 42%).
|
English language arts
|
Mathematics
|
|||
|---|---|---|---|---|
| Degree | n | % | n | % |
| Bachelor’s | 16 | 84.2 | 19 | 86.4 |
| Master’s | 16 | 84.2 | 15 | 68.2 |
| Missing | 3 | 15.8 | 3 | 13.6 |
|
English language arts
|
Mathematics
|
|
|---|---|---|
| Degree | n | n |
| Bachelor’s Degree | ||
| Education | 4 | 6 |
| Content Specific | 0 | 1 |
| Special Education | 2 | 3 |
| Other | 10 | 9 |
| Missing | 3 | 3 |
| Master’s Degree | ||
| Education | 4 | 5 |
| Content Specific | 0 | 0 |
| Special Education | 8 | 5 |
| Other | 4 | 5 |
| Missing | 3 | 3 |
Item writers reported a range of experience working with students with different disabilities, as summarized in Table 3.9. Item writers collectively had the most experience working with students with other health impairments, a significant cognitive disability, or a mild cognitive disability.
|
English language arts
|
Mathematics
|
|||
|---|---|---|---|---|
| Disability Category | n | % | n | % |
| Blind/Low Vision | 5 | 26.3 | 7 | 31.8 |
| Deaf/Hard of Hearing | 3 | 15.8 | 8 | 36.4 |
| Emotional Disability | 10 | 52.6 | 11 | 50.0 |
| Mild Cognitive Disability | 13 | 68.4 | 11 | 50.0 |
| Multiple Disabilities | 13 | 68.4 | 9 | 40.9 |
| Orthopedic Impairment | 3 | 15.8 | 7 | 31.8 |
| Other Health Impairment | 14 | 73.7 | 12 | 54.5 |
| Significant Cognitive Disability | 13 | 68.4 | 12 | 54.5 |
| Specific Learning Disability | 12 | 63.2 | 11 | 50.0 |
| Speech Impairment | 11 | 57.9 | 10 | 45.5 |
| Traumatic Brain Injury | 5 | 26.3 | 6 | 27.3 |
| None of the above | 0 | 0.0 | 2 | 9.1 |
| Not reported | 4 | 21.1 | 6 | 27.3 |
3.2 External Reviews
The purpose of external review is to evaluate items and testlets developed for the DLM Alternate Assessment System. Using specific criteria established for DLM assessments, reviewers decided whether to recommend that the content be accepted, revised, or rejected. Feedback from external reviewers is used to make final decisions about assessment items before they are field-tested.
The process for external review in 2019–2020 was updated from external reviews in the previous three review cycles. Changes included hosting a hybrid event, with both online training and an on-site event and updating the training process and resources for external reviewers.
3.2.1 Review Recruitment, Assignments, and Training
At the end of March 2020, a voluntary survey was used to recruit external review panelists. Candidates for the external review process completed a Qualtrics survey to capture demographic information as well as information about their education and work experience. The candidates were screened by the implementation and test development teams to ensure they qualified. Recruitment data were then used to identify panel types (content, bias and sensitivity, and accessibility) for which the candidate would be eligible. The test development teams looked at certifications and years of teaching and balanced selections to the greatest extent possible across grade level experience, state of residence, diversity, and population density. All panelists had at least three years of teaching experience.
Of the 53 reviewers placed on ELA and mathematics panels, 46 completed reviews. Each reviewer was assigned to one of the three panel types. There were 24 ELA reviewers: eight on accessibility panels, 12 on content panels, and four on bias and sensitivity panels. There were 22 mathematics reviewers: eight on accessibility panels, ten on content panels, and four on bias and sensitivity panels.
ELA and mathematics panelists completed seven to 12 rounds of reviews, depending on which panel they served. Each round consisted of a collection of between nine and 15 testlets, dependent on the panel type. Content panels had the smallest number of testlets per collection, and bias and sensitivity panels had the largest number of testlets per collection.
The professional roles reported by the 2019–2020 reviewers are shown in Table 3.10. Roles included teachers, instructional coaches, and district staff. Reviewers who reported “other” roles included program coordinators, process coordinators, supervisors of instruction, and individuals identifying with multiple categories.
|
English language arts
|
Mathematics
|
|||
|---|---|---|---|---|
| Role | n | % | n | % |
| Classroom Teacher | 16 | 66.7 | 18 | 81.8 |
| District Staff | 5 | 20.8 | 4 | 18.2 |
| Instructional Coach | 1 | 4.2 | 0 | 0.0 |
| Other | 2 | 8.3 | 0 | 0.0 |
Reviewers had varying experience teaching students with the most significant cognitive disabilities. ELA reviewers had a median of six years of experience, with a minimum of zero and a maximum of 42 years of experience. Mathematics reviewers had a median of eight years of experience teaching students with the most significant cognitive disabilities, with a minimum of zero and a maximum of 22 years of experience.
Among the ELA and mathematics panels, panelists represented 12 DLM states. ELA panelists were from 10 different states, and mathematics panelists were from 10 different states. Population density of schools in which reviewers taught or held a position is reported in Table 3.11. Within the survey, rural was defined as a population living outside settlements of 1,000 or fewer inhabitants, suburban was defined as an outlying residential area of a city of 2,000–49,000 or more inhabitants, and urban was defined as a city of 50,000 inhabitants or more.
|
English language arts
|
Mathematics
|
|||
|---|---|---|---|---|
| Population Density | n | % | n | % |
| Rural | 4 | 16.7 | 5 | 22.7 |
| Suburban | 8 | 33.3 | 5 | 22.7 |
| Urban | 8 | 33.3 | 4 | 18.2 |
| Not Applicable | 4 | 16.7 | 8 | 36.4 |
Prior to attending the on-site external review event, panelists completed an advance training course. The course included five modules that all panelists had to complete, allowing the panelists to gain familiarity with all areas being covered. All panelists completed the following modules: DLM Overview and External Review Process, Accessibility, Bias and Sensitivity, and Content. Each content module was subject-specific, while the bias and sensitivity and accessibility modules were universal for all subjects. After each module, the panelists had to complete a quiz and receive a score of at least 80% to continue to the next module. Panelists were required to complete advance training prior to reviewing any testlets at the event.
Review of testlets was completed only during the two days of the on-site event. Due to technical issues, not all panelists had time to review as many testlets as in prior years. As a consequence, some subject rooms saw fewer testlets reviewed than others. Panelists reviewed each testlet on their own and then as a group. Each group came to a consensus for each item and testlet, and the facilitator recorded the recommendation.
3.2.2 Results of Reviews
Panelists recommended most content be accepted. For ELA, the percentage of items rated as accept across grades, panels, and rounds of review ranged from 56% to 91%. The percentage of testlets rated as accept across grades, panels, and rounds of review ranged from 82% to 92%. The percentage of items and testlets rated as revise across grades, panels, and rounds of review ranged from 9% to 33% and 4% to 15%, respectively. The rate at which items and testlets were recommended for rejection ranged from 0% to 12% and 3% to 11%, respectively, across grades, pools, and rounds of review.
For mathematics, the percentage of items and testlets rated as accept ranged from 86% to 99% and 78% and 91%, respectively. The percentage of items and testlets rated as revise ranged from 8% to 22% and 1% to 14% respectively. The rate at which both items and testlets were recommended for rejection ranged from 0% to 1% across grades, pools, and rounds of review.
3.2.3 Test Development Decisions
Because each item and testlet was examined by three separate panels, external review ratings were compiled across panel types, following the same process as previous years. DLM test development teams reviewed and summarized the recommendations provided by the external reviewers for each item and testlet. Based on that combined information, staff had five decision options: (a) no pattern of similar concerns, accept as is; (b) pattern of minor concerns, will be addressed; (c) major revision needed; (d) reject; and (e) more information needed.
DLM test development teams documented the decision category applied by external reviewers to each item and testlet. Following this process, test development teams made a final decision to accept, revise, or reject each of the items and testlets. The ELA test development team retained 98% of items and testlets sent out for external review. Of the items and testlets that were revised, test development teams determined whether they required minor changes (e.g., minor rewording but concept remained unchanged), or major changes (e.g., stem or option replaced). The ELA team made only two minor revisions to items, compared to 14 major revisions to testlets, and rejected one testlet. The mathematics test development team retained 100% of items and testlets sent out for external review. The mathematics team made 68 minor revisions to items and 60 major revisions to testlets. Most of the content reviewed during this external review is scheduled for the fall 2020 and spring 2021 windows.
3.3 Operational Assessment Items for 2019–2020
A total of 51,809 test sessions were administered during the spring testing window. One test session is one testlet taken by one student. Only test sessions that were complete at the close of each testing window counted toward the total sessions.
Testlets were made available for operational testing in 2019–2020 based on the 2018–2019 operational pool and the promotion of testlets field-tested during 2018–2019 to the operational pool following their review. Table 3.12 summarizes the total number of operational testlets for 2019–2020 for ELA and mathematics. There were 2,681 operational testlets available across grades and subjects. This total included 550 (219 mathematics, 331 ELA) EE/linkage level combinations for which both a general version and a version for students who are blind or visually impaired or read braille were available.
|
Fall Operational
|
Spring Operational
|
|||
|---|---|---|---|---|
| Grade | English language arts (n) | Mathematics (n) | English language arts (n) | Mathematics (n) |
| 3 | 134 | 78 | 54 | 45 |
| 4 | 136 | 110 | 60 | 46 |
| 5 | 167 | 105 | 54 | 48 |
| 6 | 155 | 73 | 56 | 46 |
| 7 | 129 | 95 | 57 | 38 |
| 8 | 148 | 95 | 49 | 46 |
| 9-10 | 125 | 188 | 53 | 115 |
| 11-12 | 122 | * | 54 | * |
| * In mathematics high school is banded in grades 9–11. | ||||
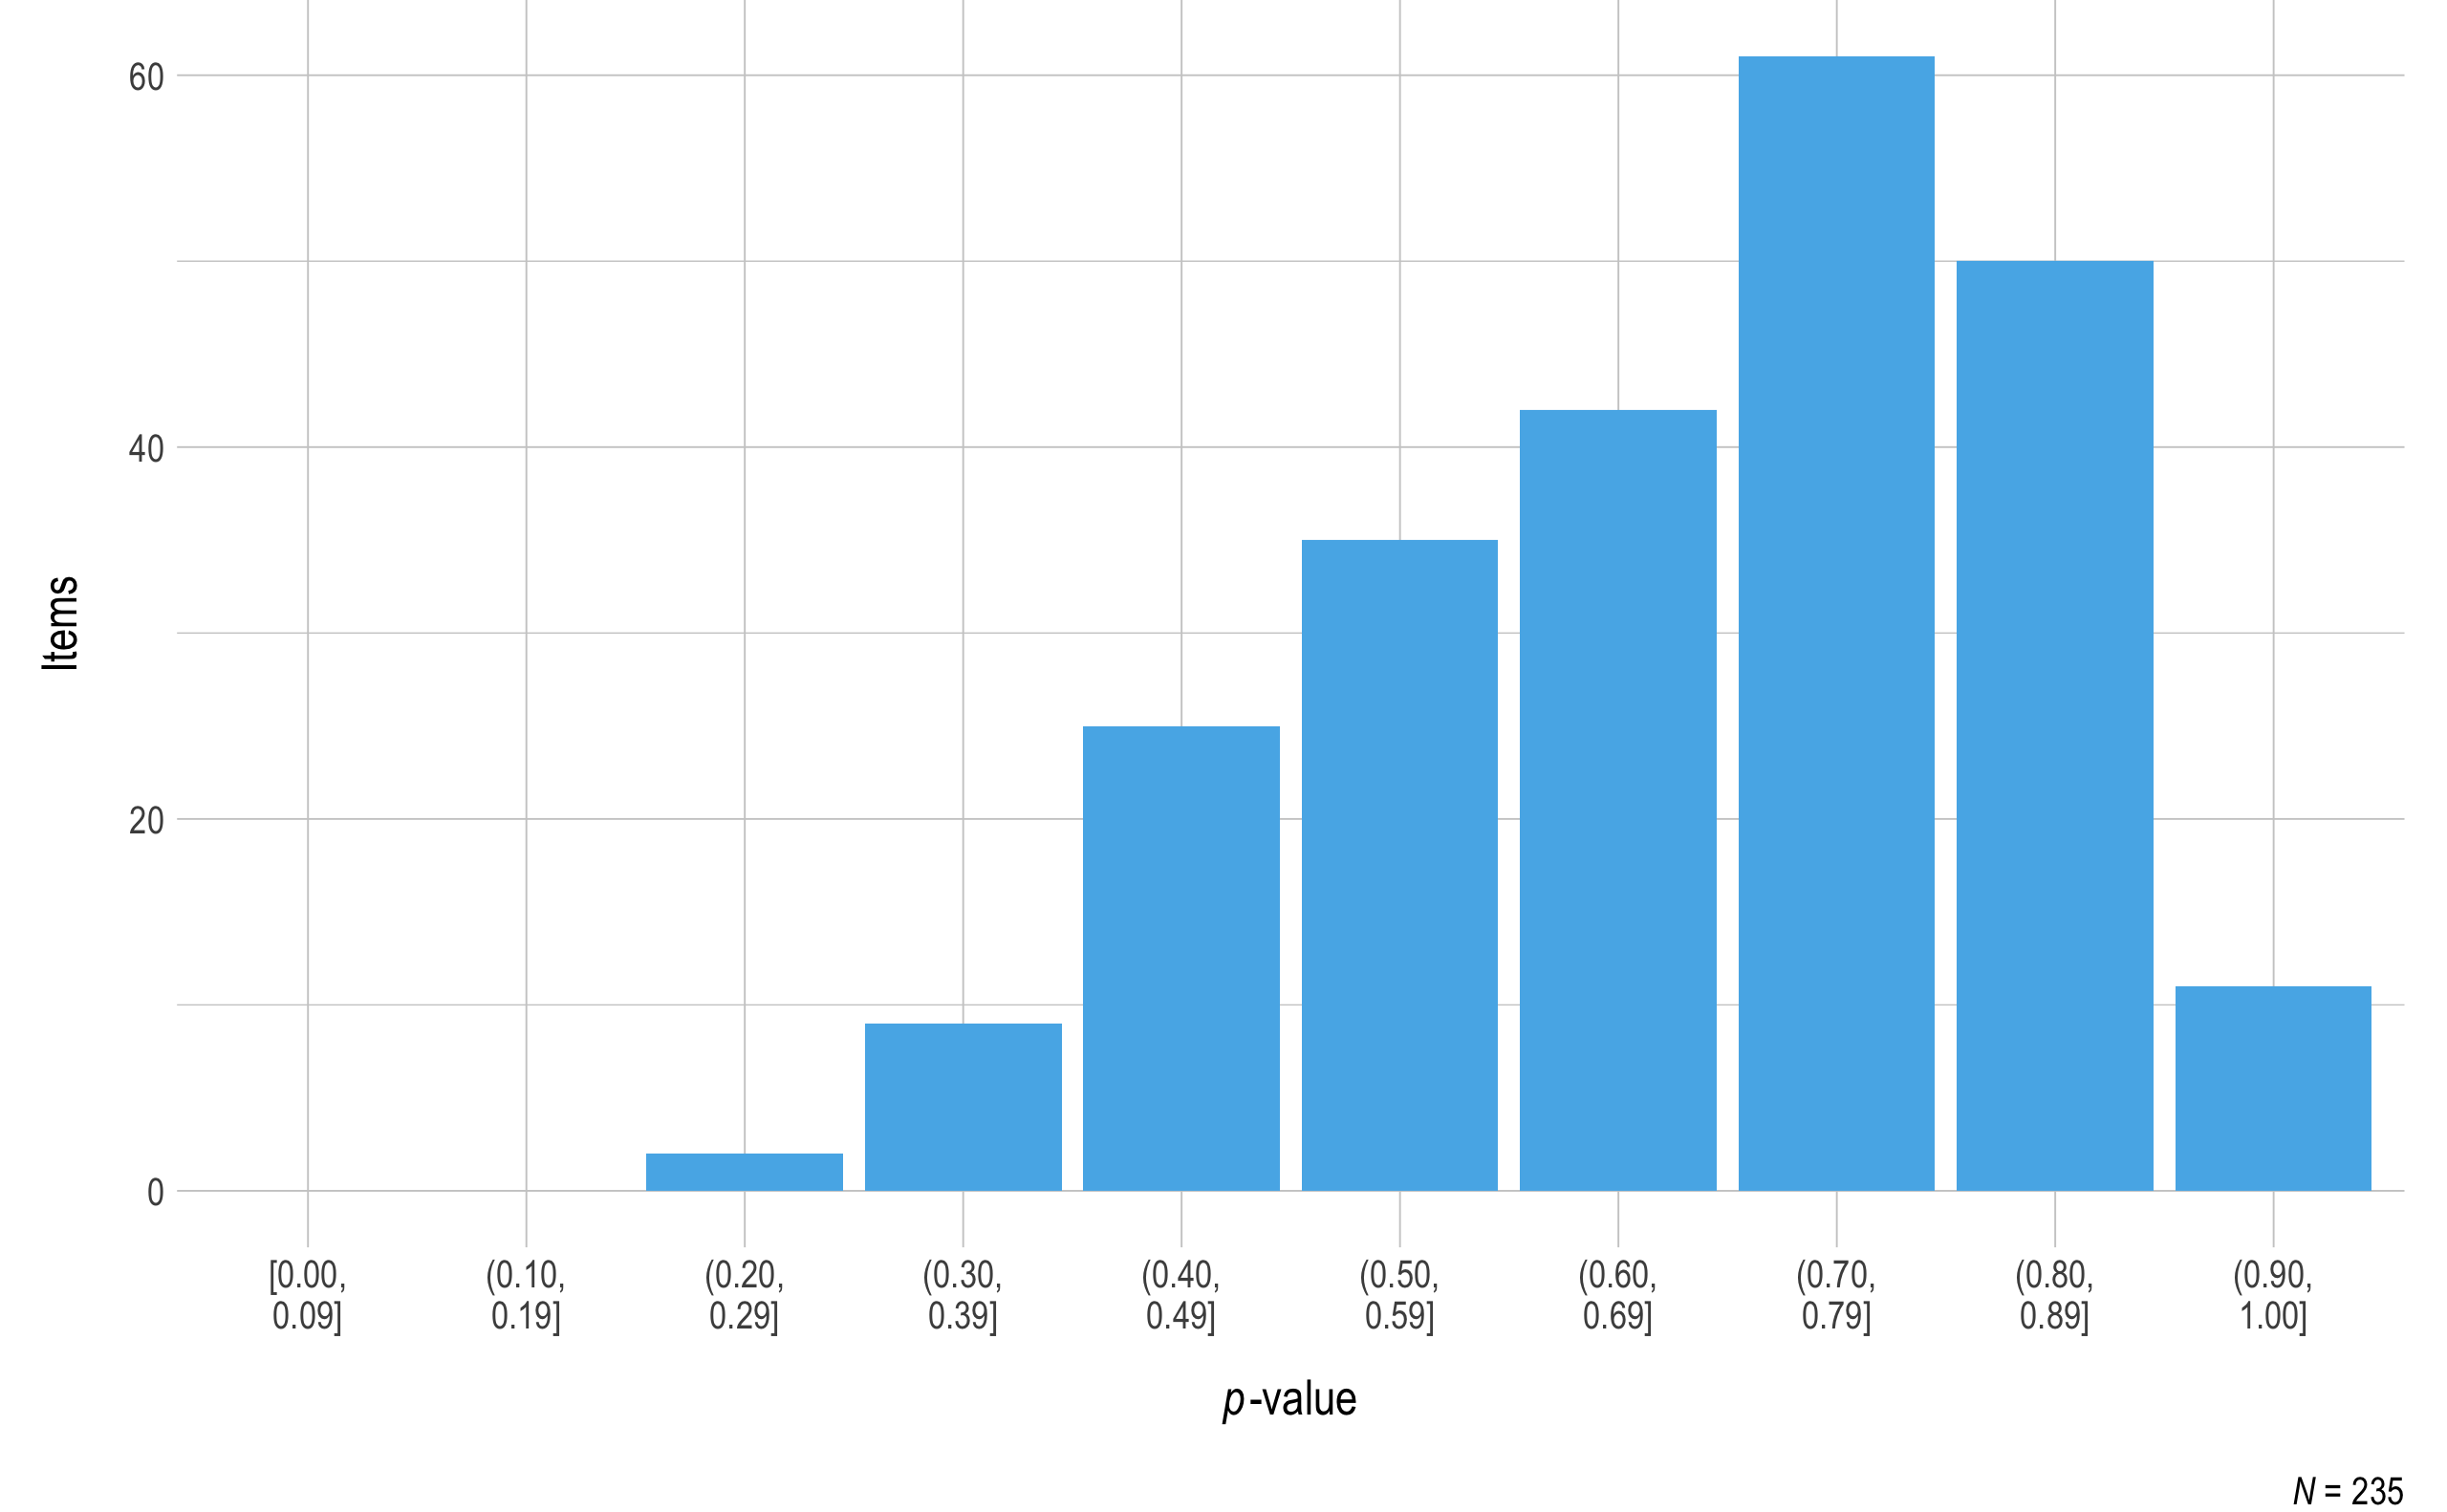
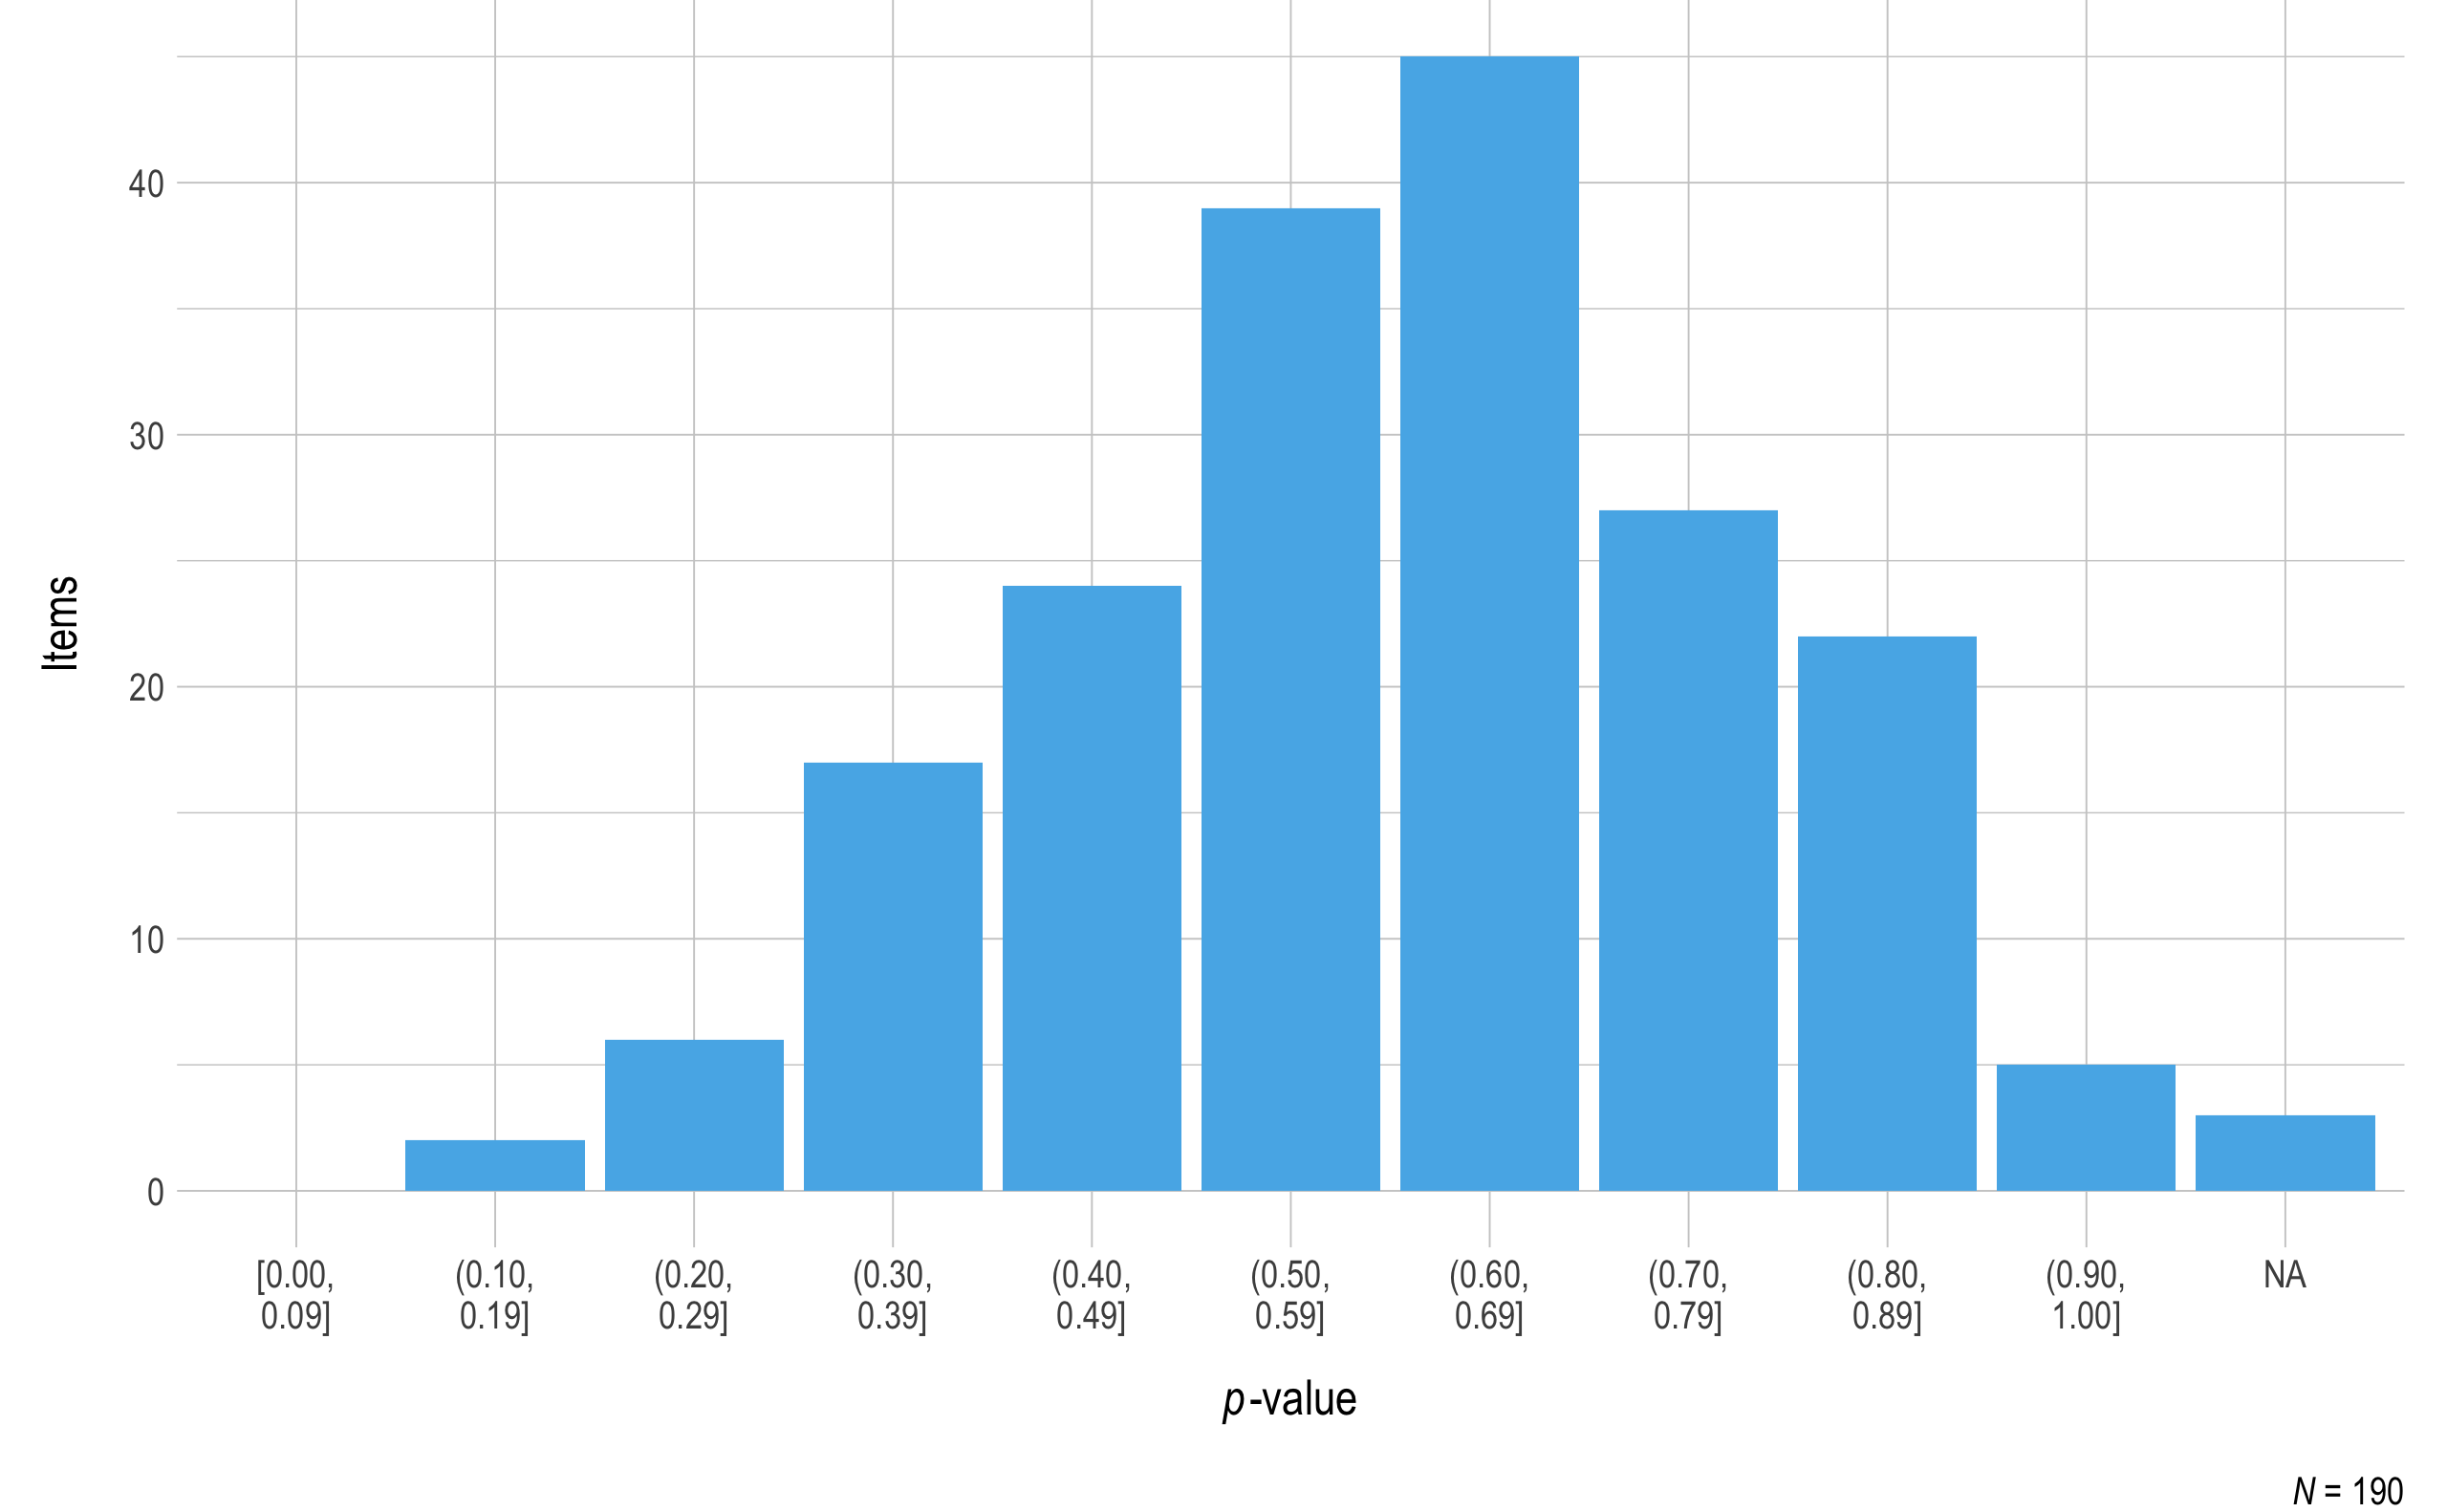
Similar to prior years, the proportion correct (p-value) was calculated for all operational items to summarize information about item difficulty.
Figure 3.1 and Figure 3.2 include the p-values for each operational item for ELA and mathematics, respectively. To prevent items with small sample sizes from potentially skewing the results, the sample size cutoff for inclusion in the p-value plots was 20. In general, ELA items were easier than mathematics items, as evidenced by the presence of more items in the higher bin (p-value) ranges.
Figure 3.1: p-values for ELA 2019–2020 operational items.
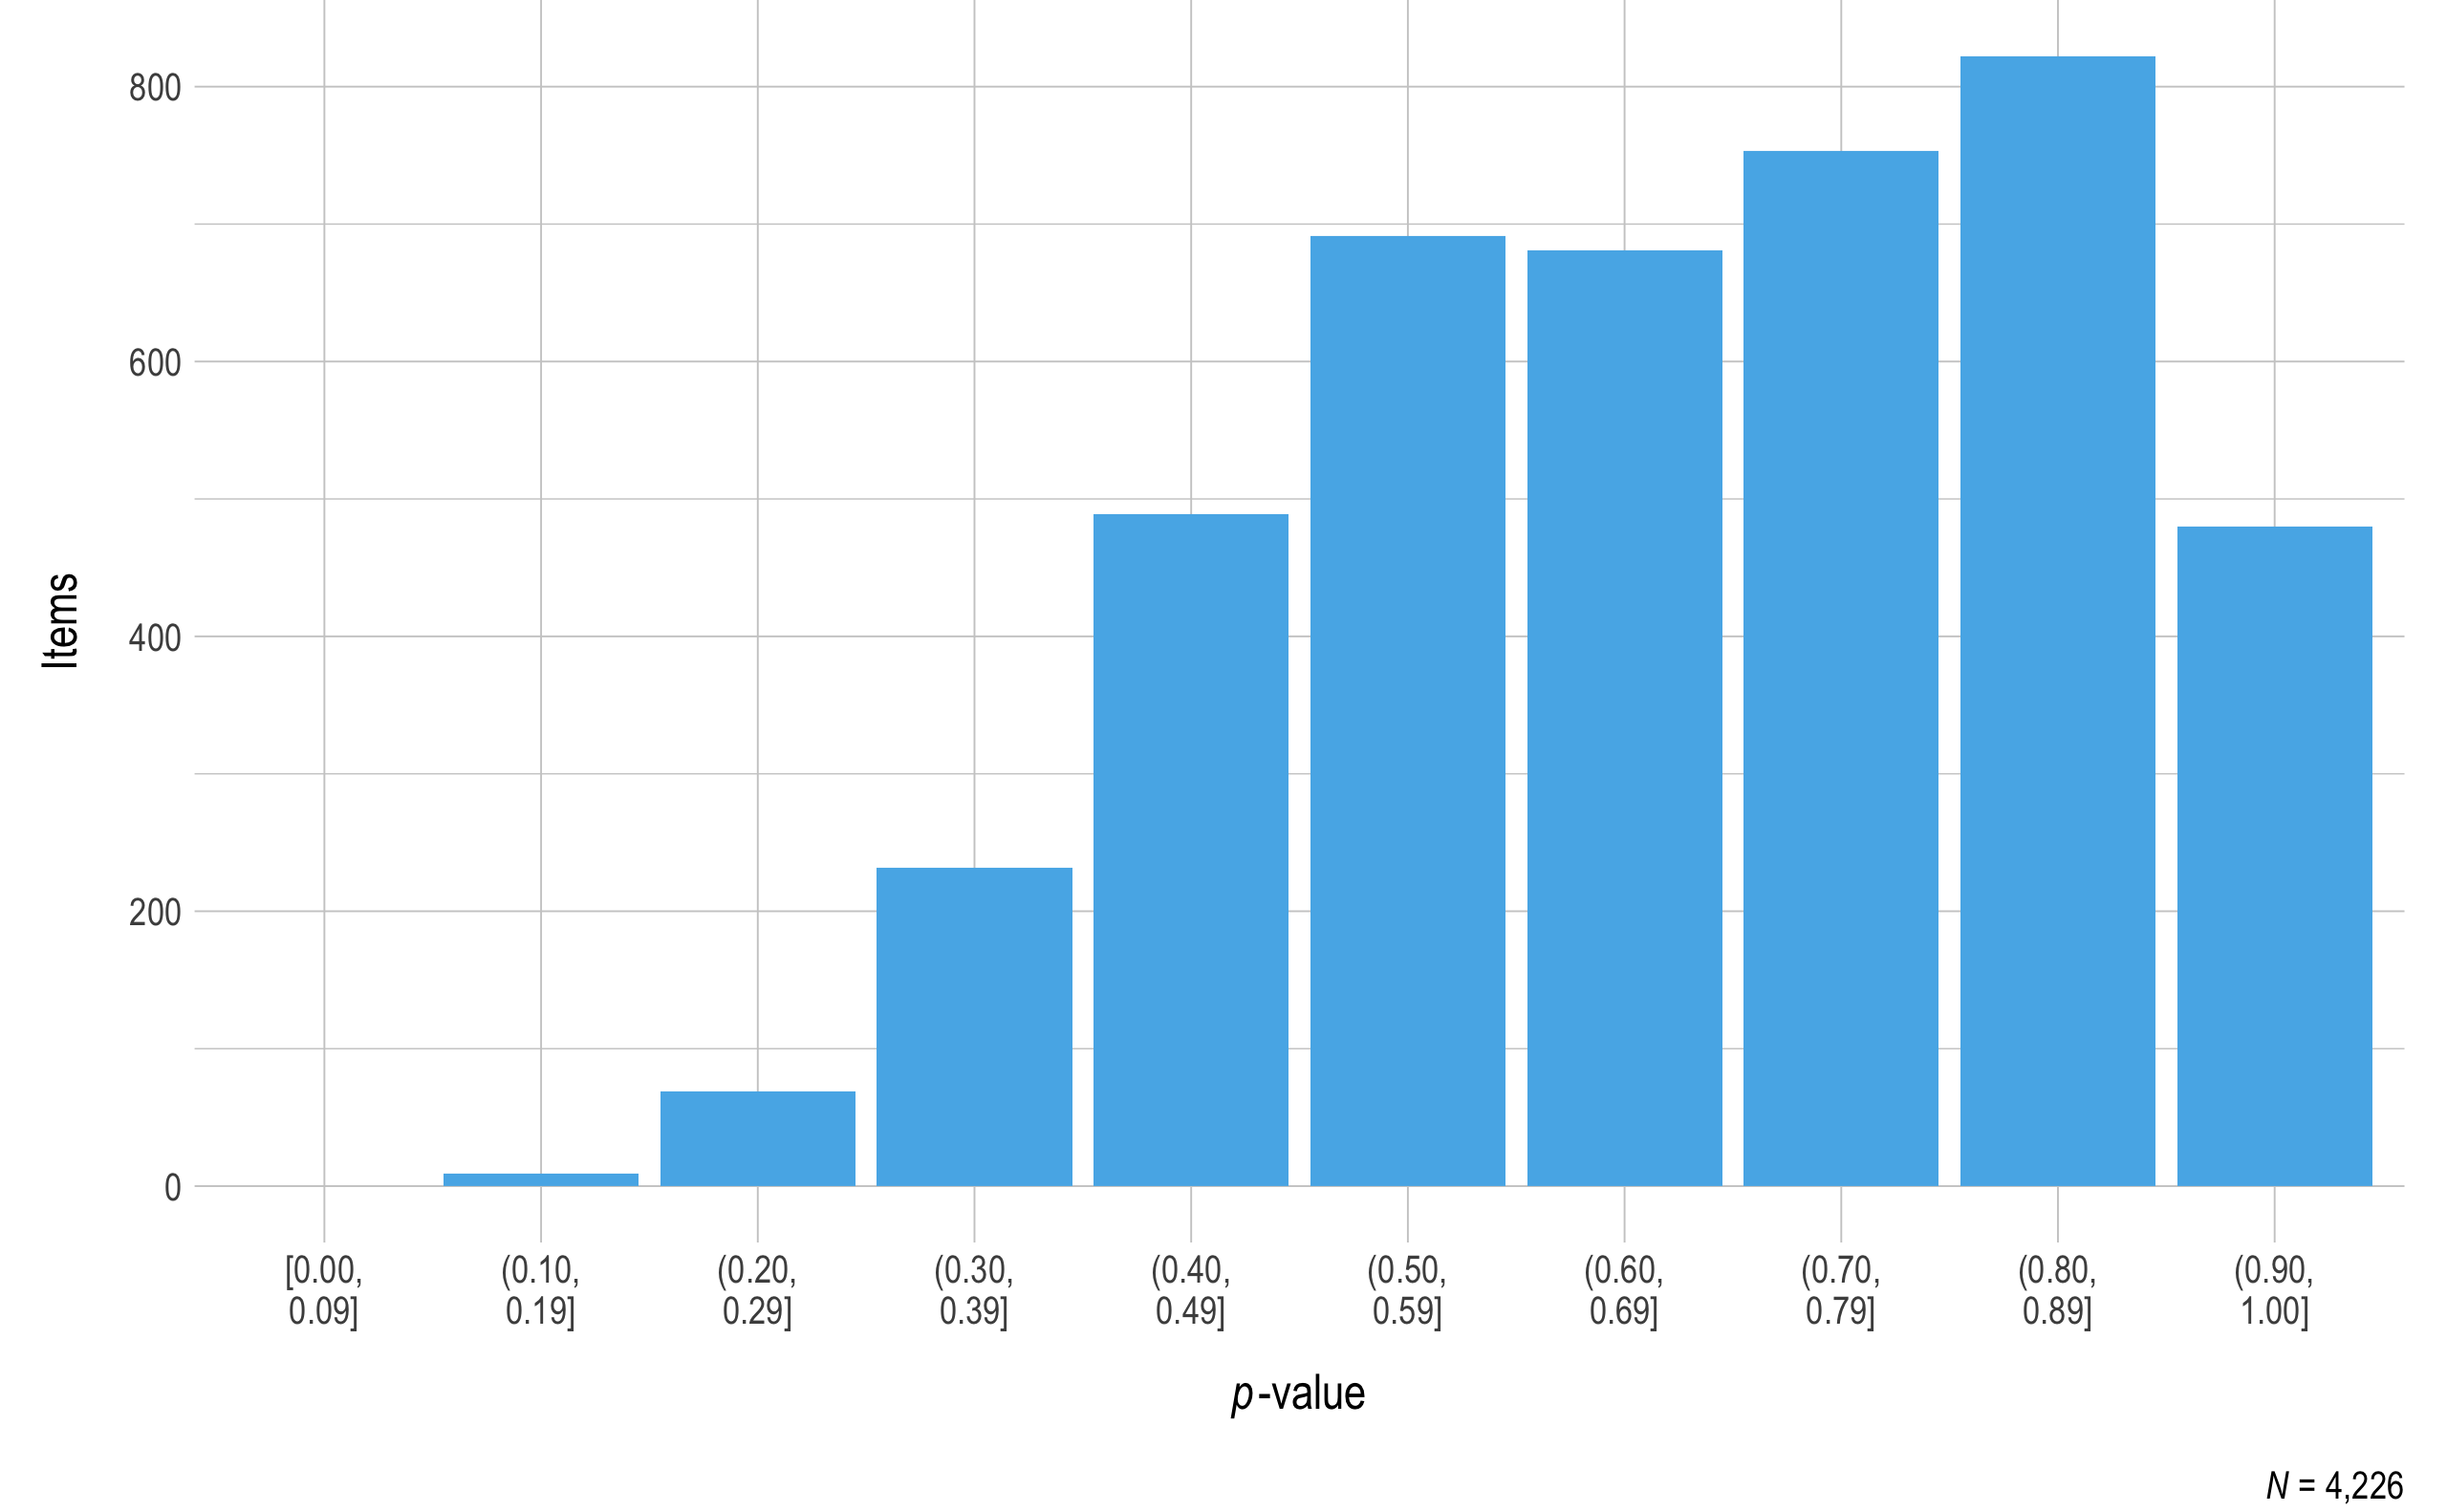
Note. Items with a sample size of less than 20 were omitted.
Figure 3.2: p-values for mathematics 2019–2020 operational items.
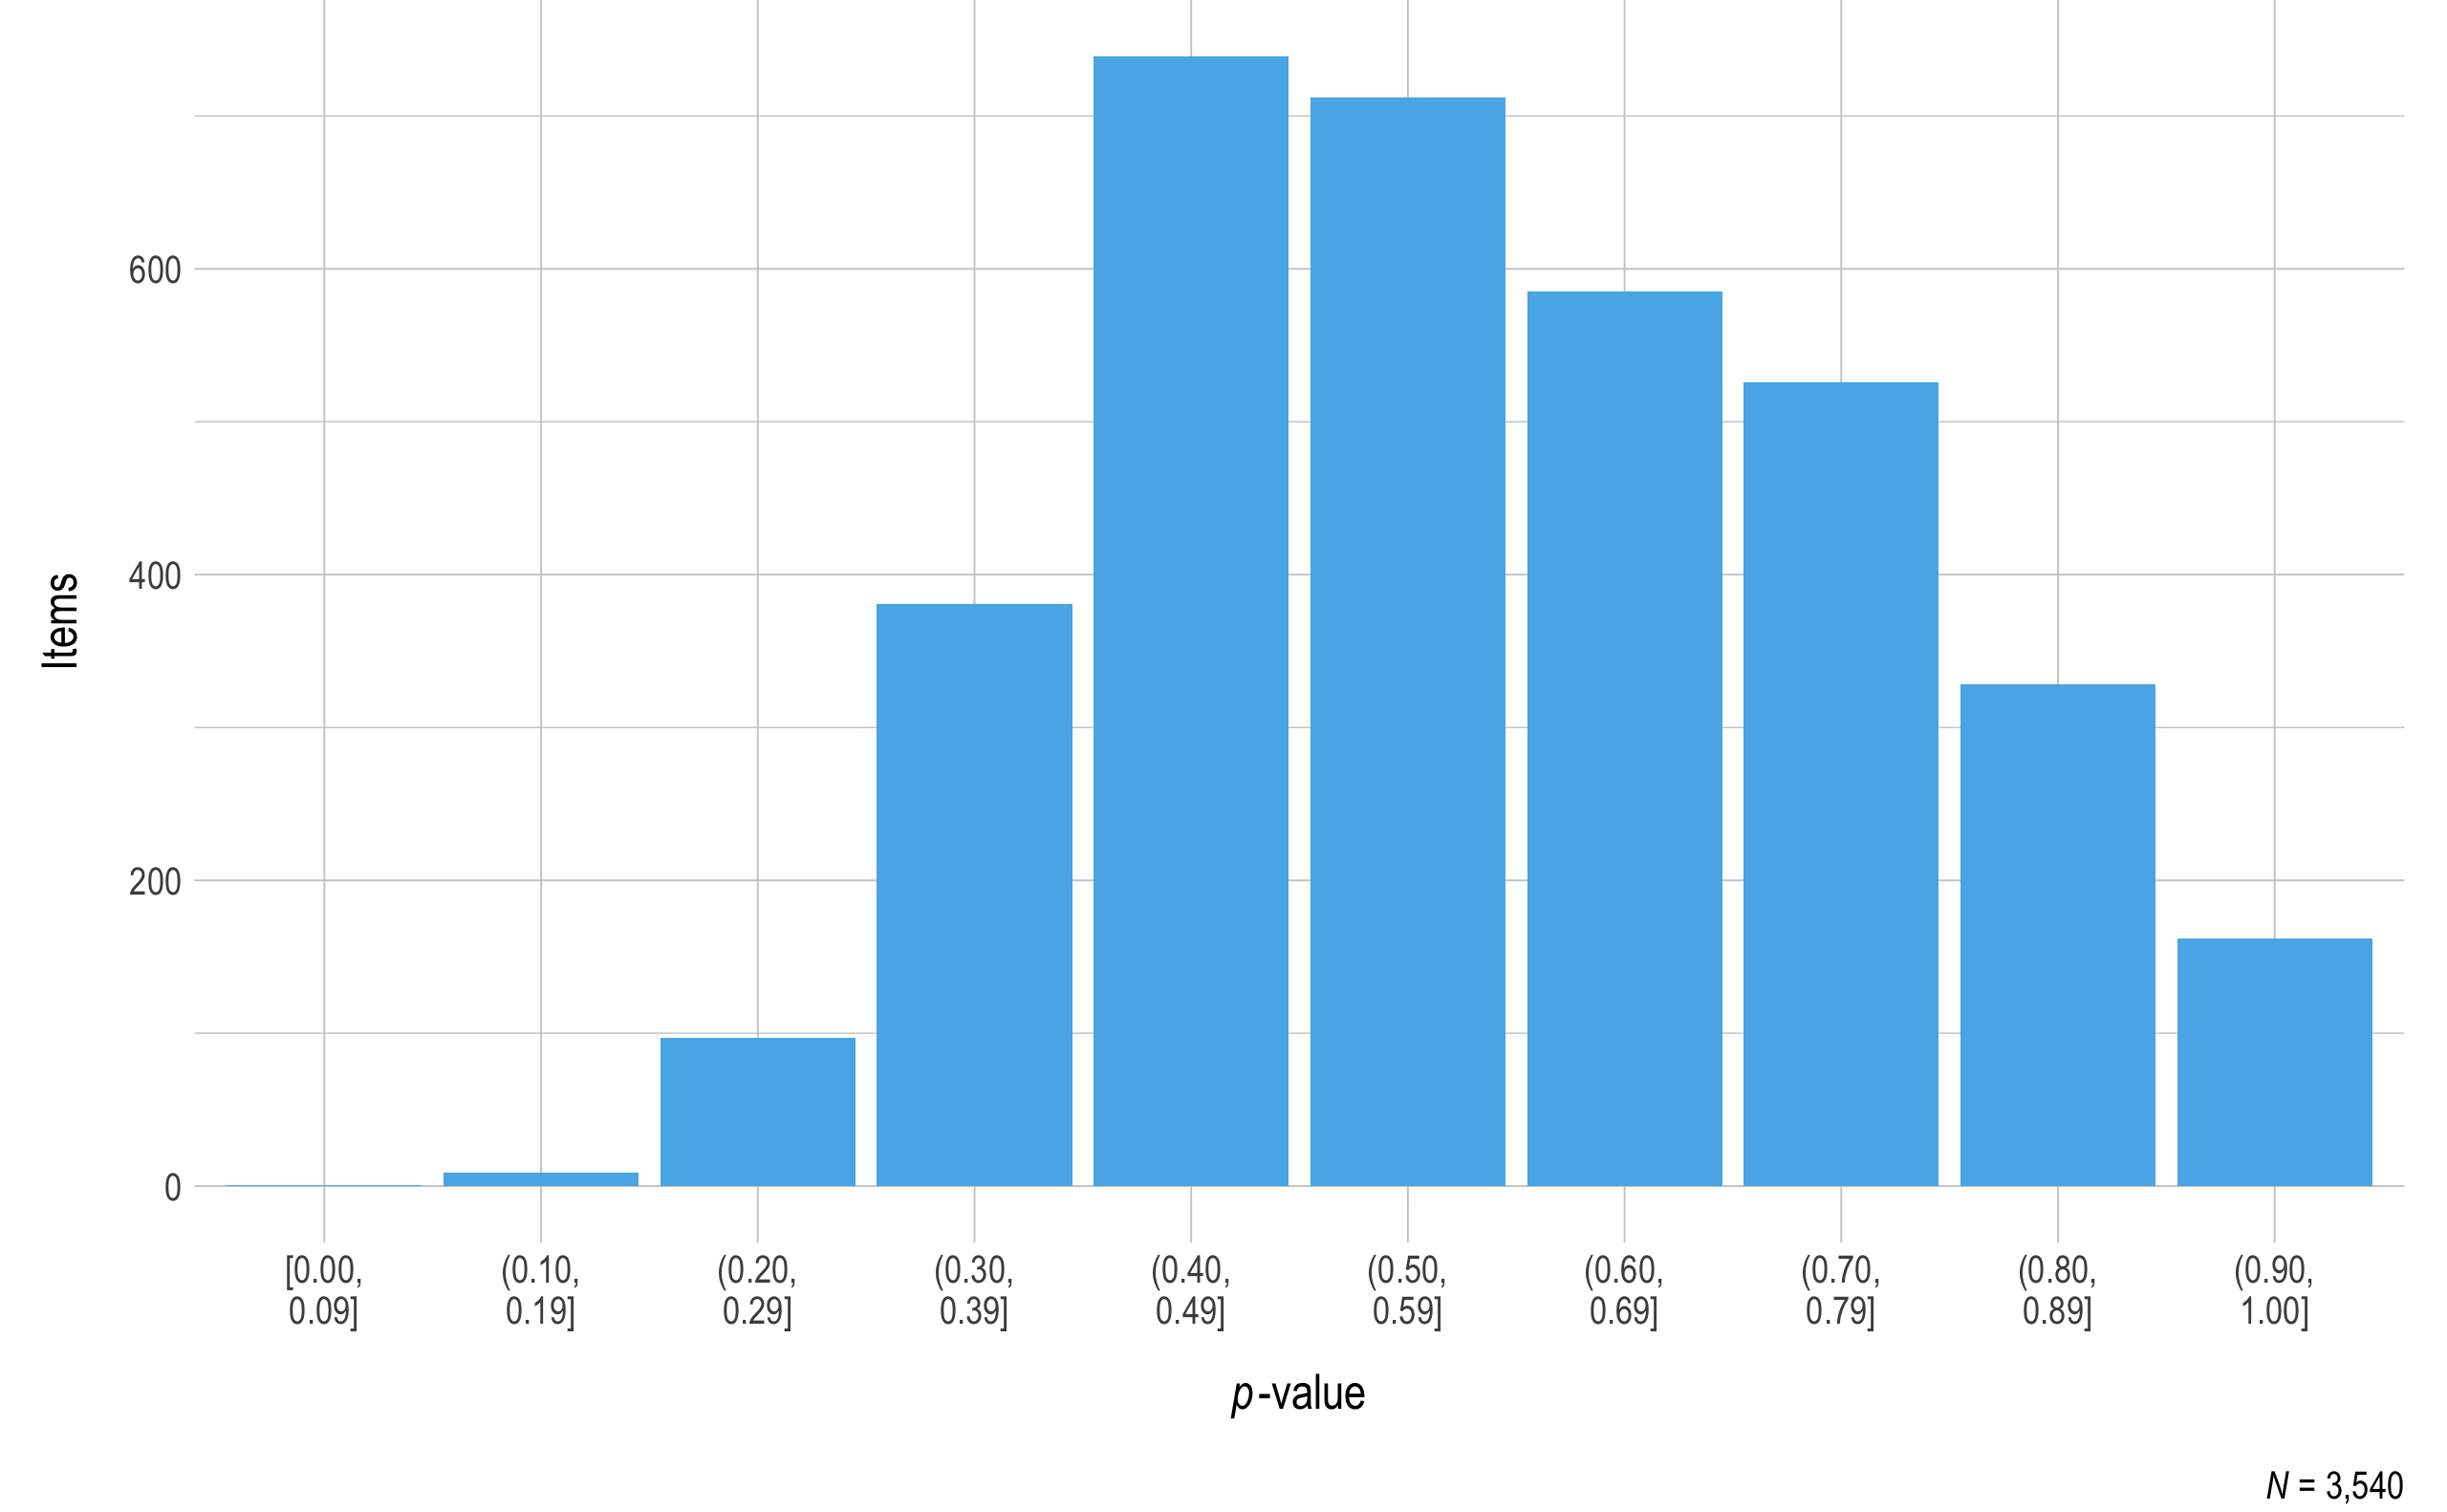
Note. Items with a sample size of less than 20 were omitted.
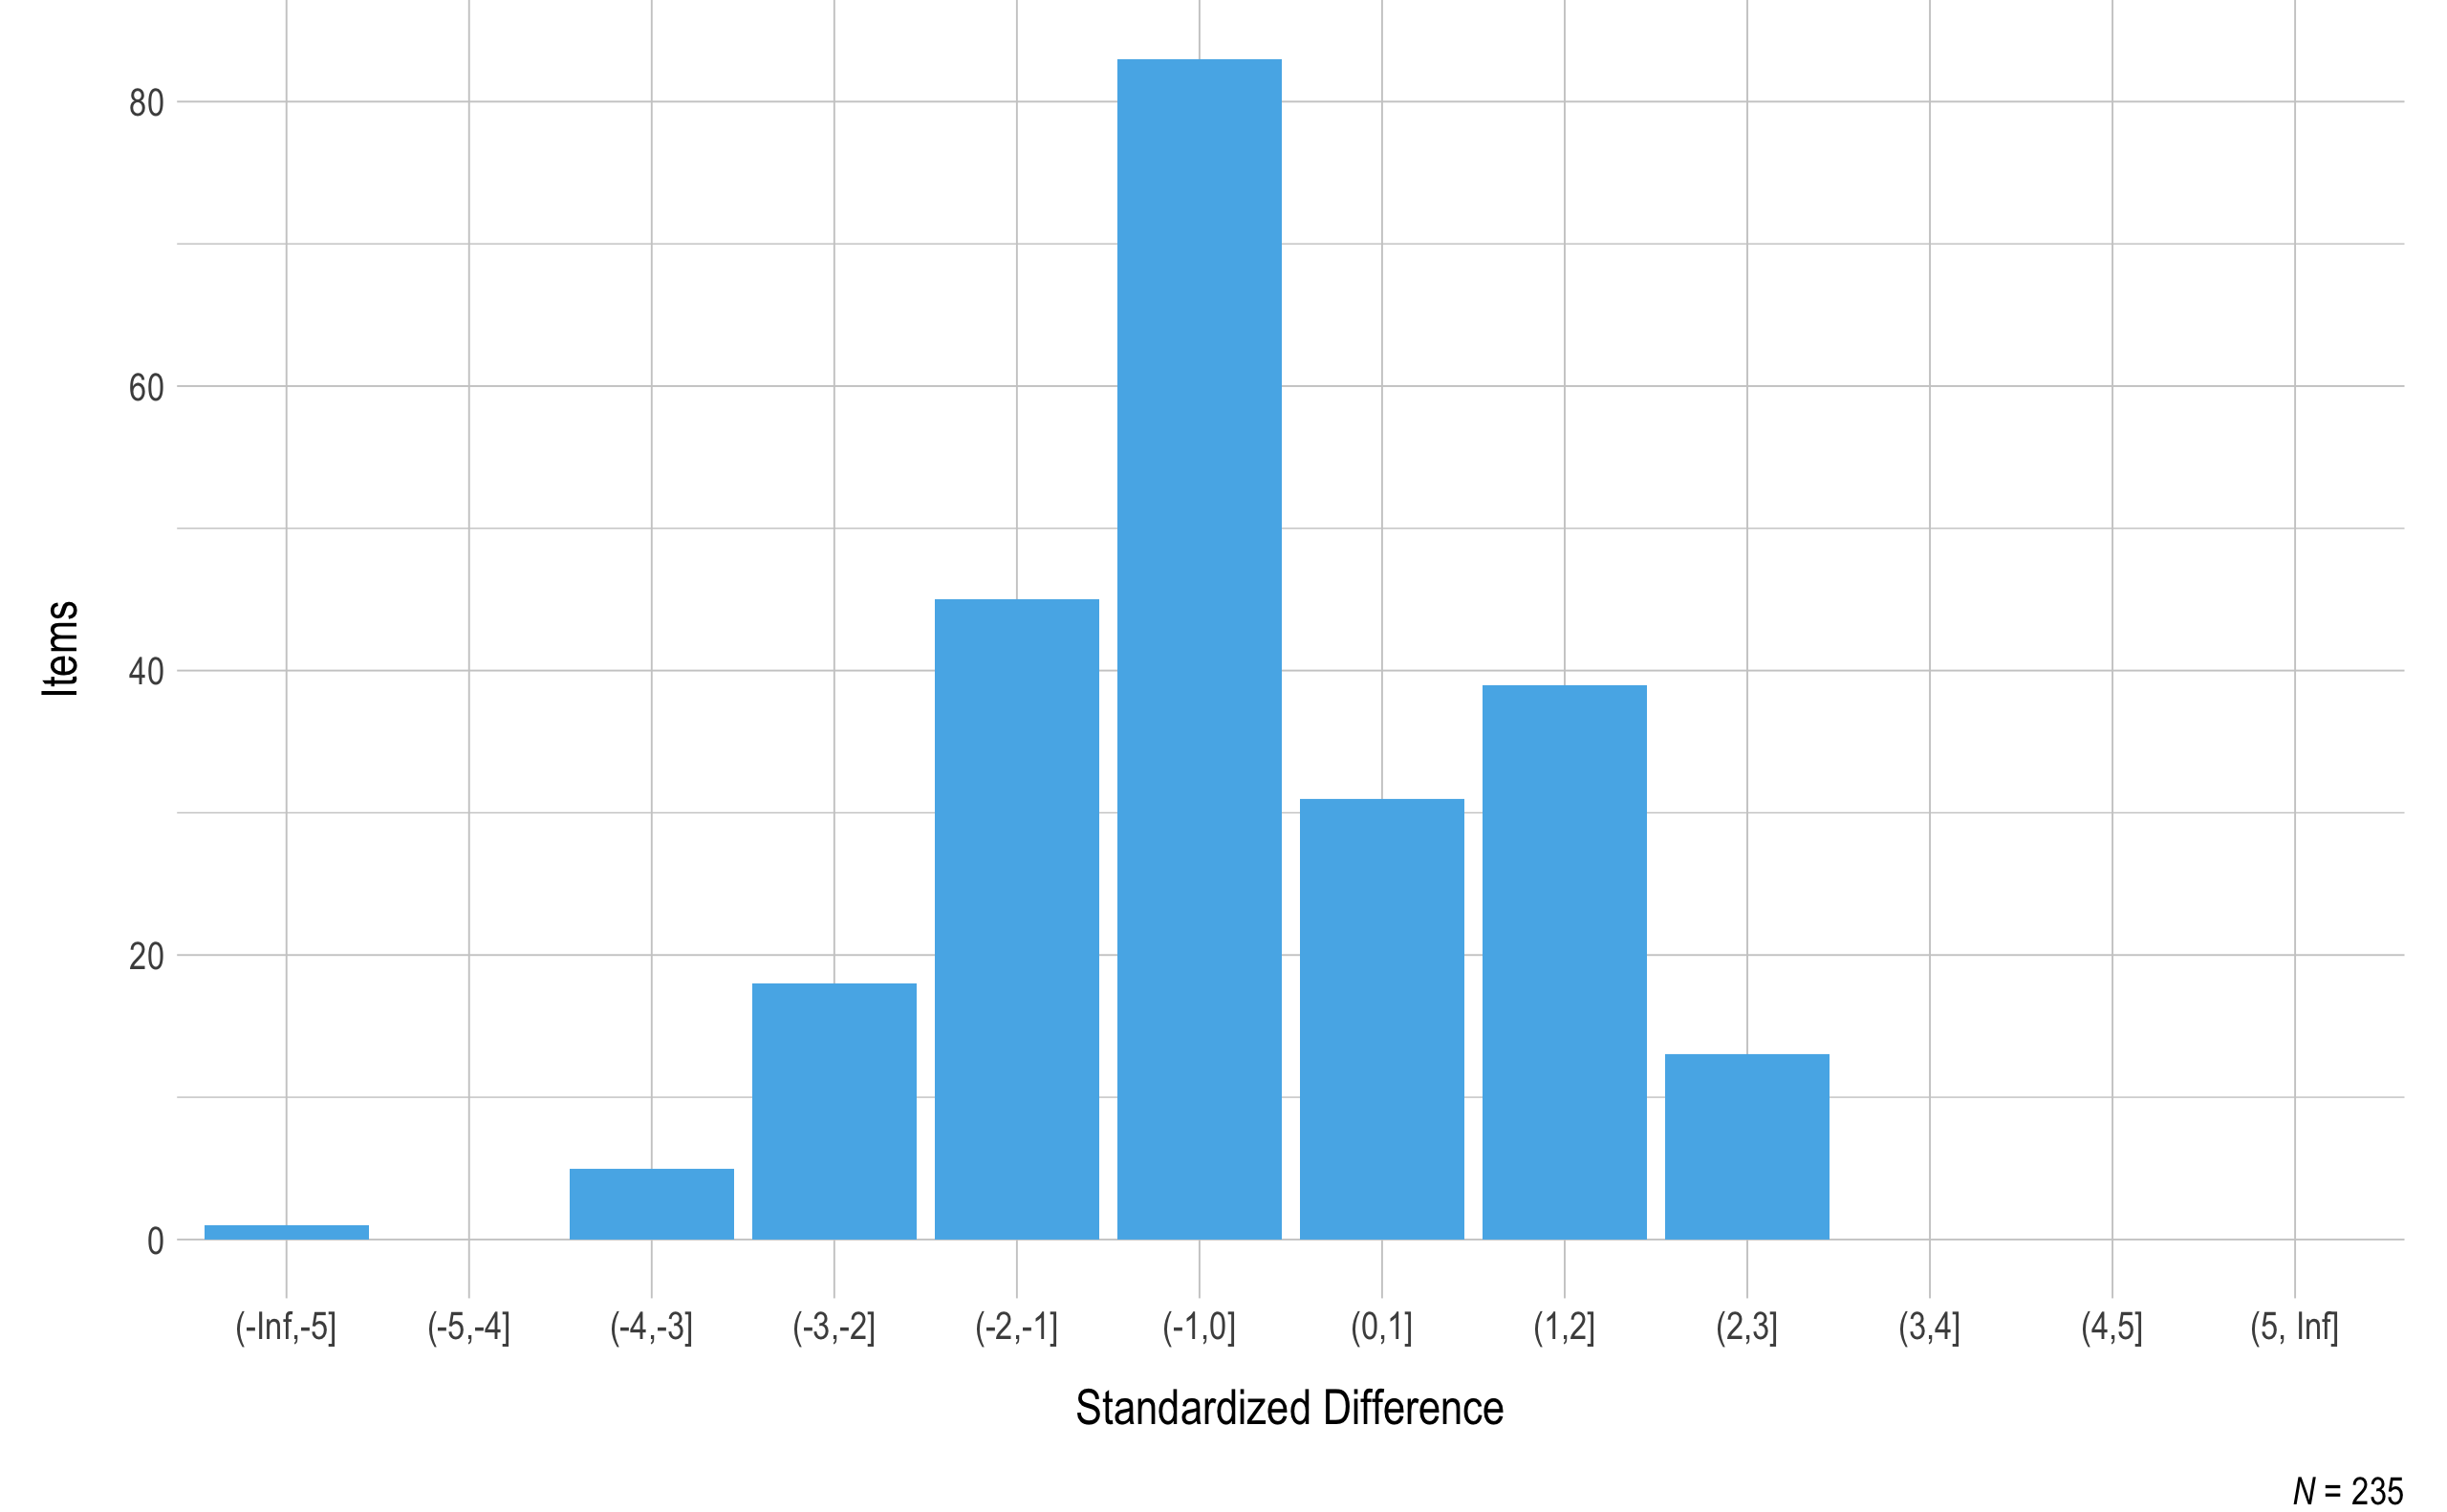
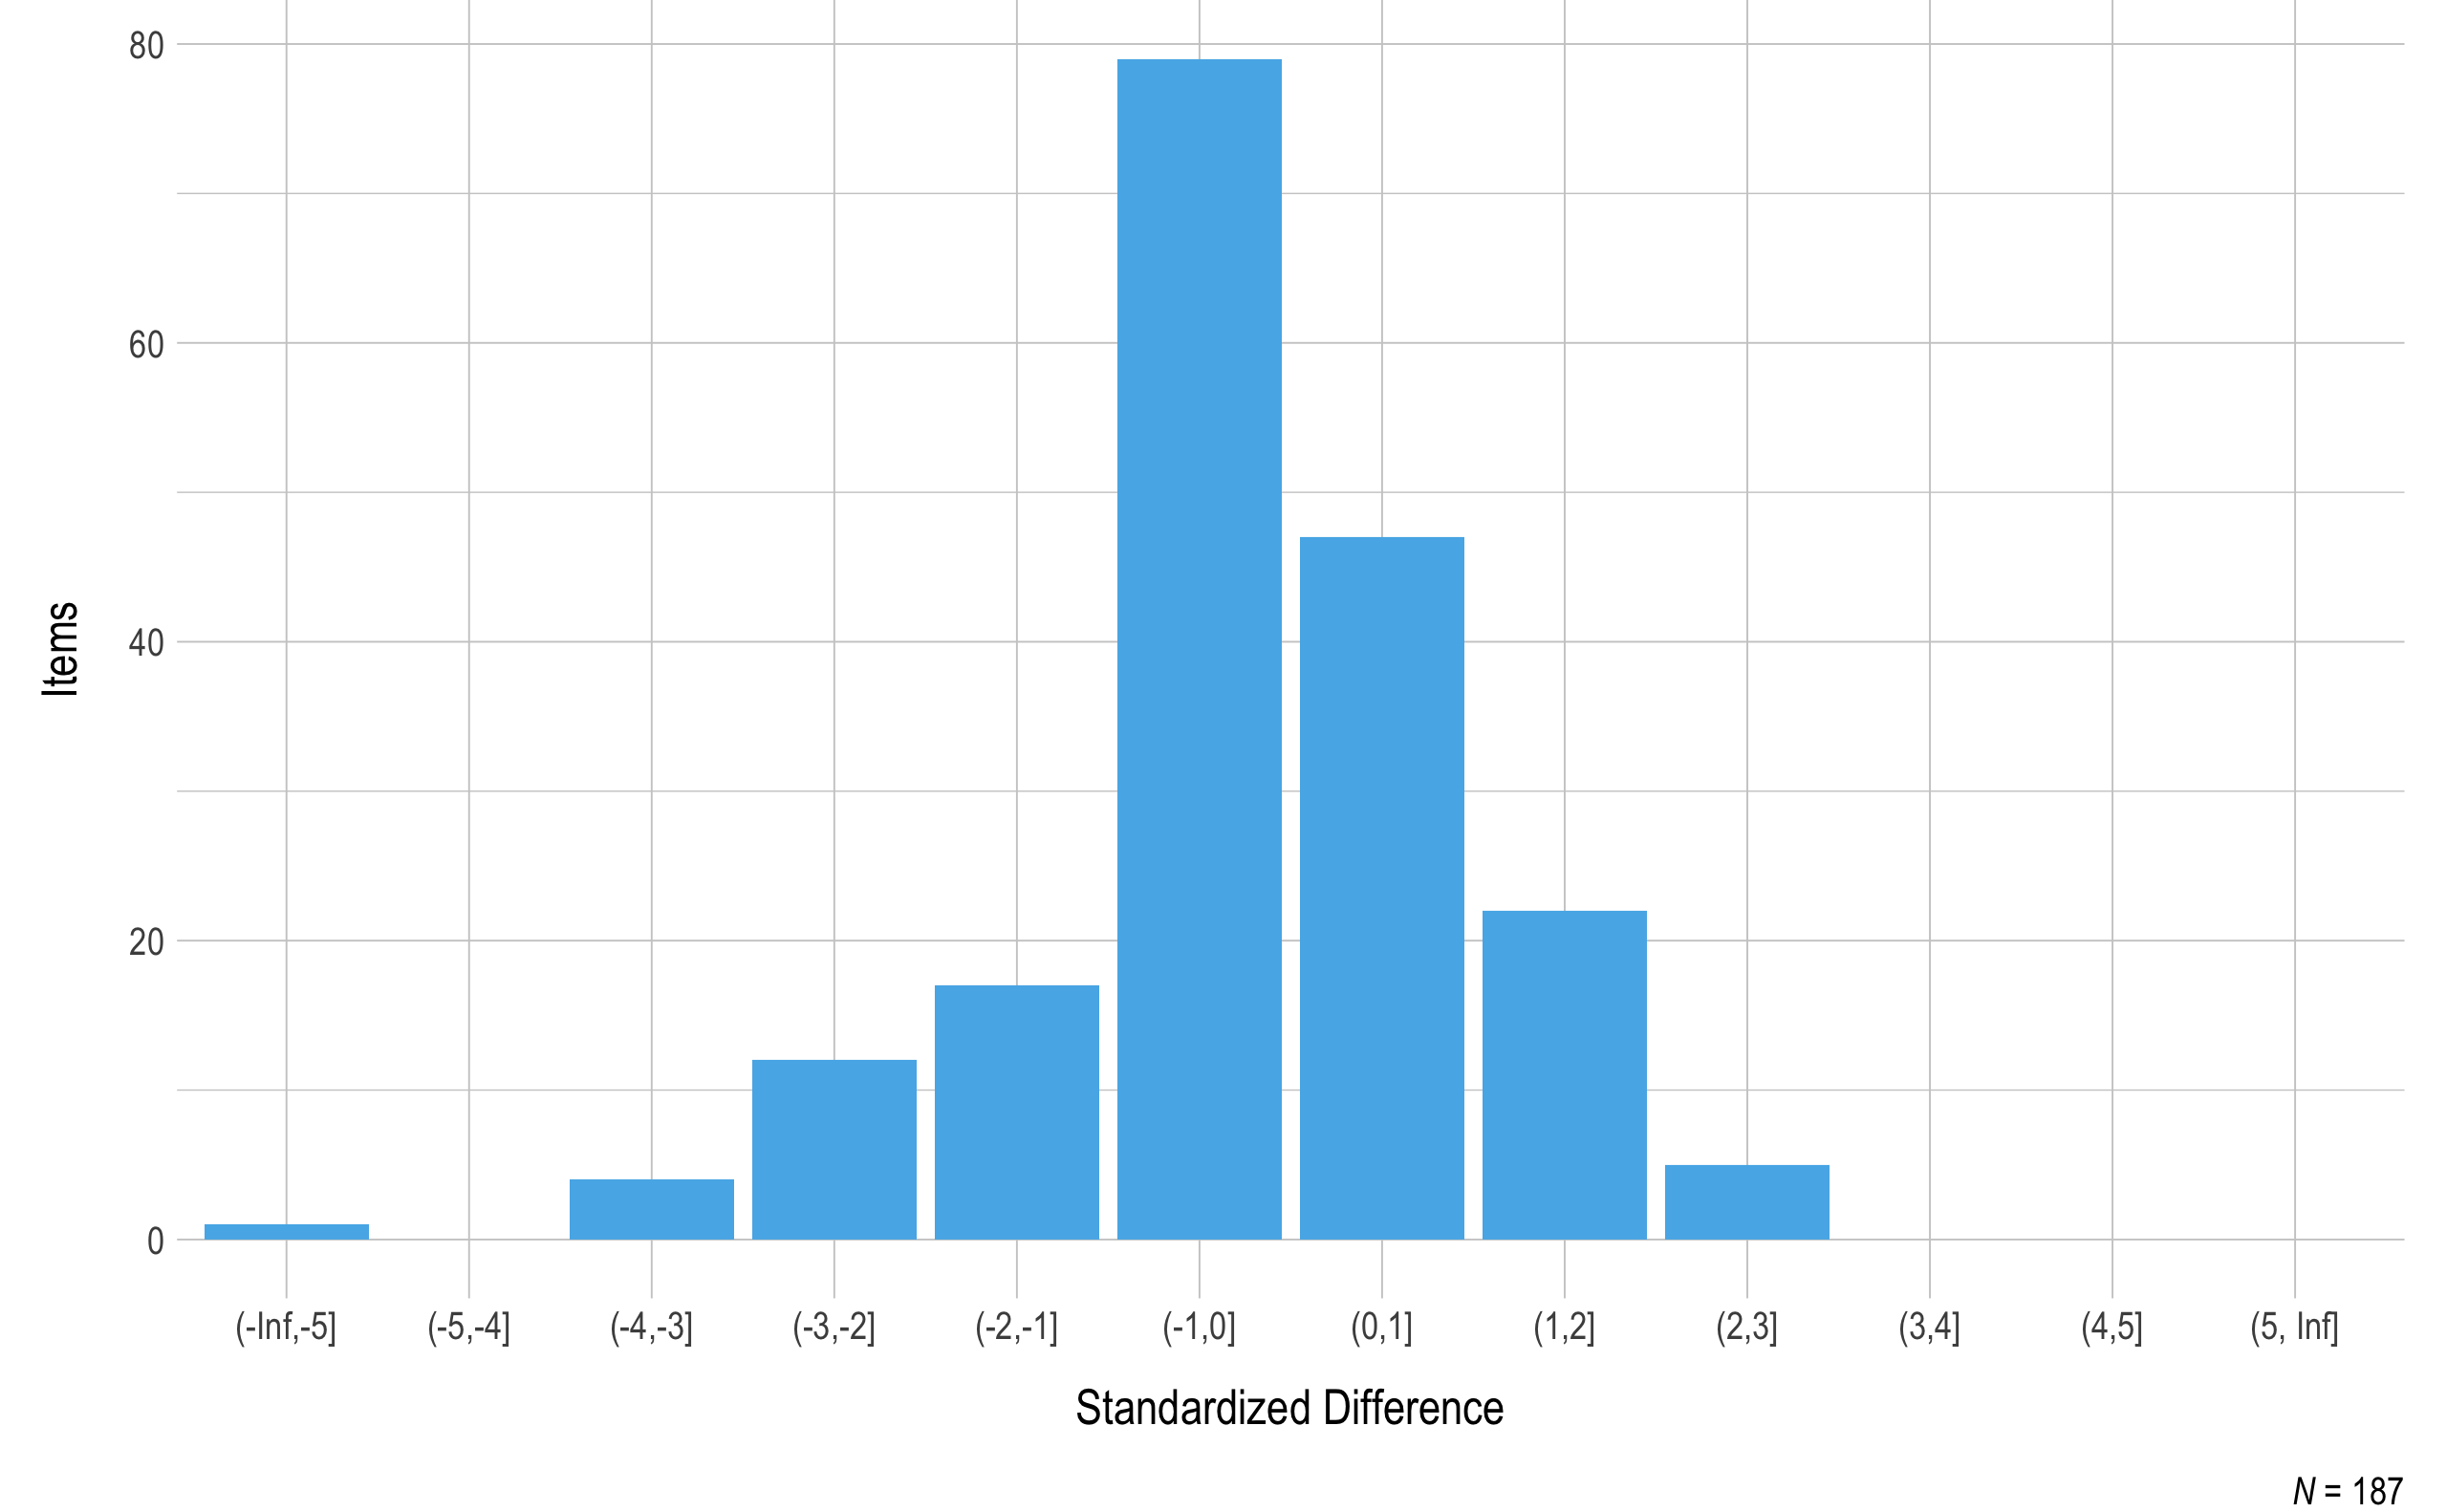
Standardized difference values were also calculated for all operational items, with a student sample size of at least 20 required to compare the p-value for the item to all other items measuring the same EE and linkage level. The standardized difference values provide one source of evidence of internal consistency. See Chapter 9 in this manual for additional information.
Figure 3.3 and Figure 3.4 summarize the standardized difference values for operational items for ELA and mathematics, respectively. Most items fell within two standard deviations of the mean of all items measuring the EE and linkage level. As additional data are collected and decisions are made regarding item pool replenishment, test development teams will consider item standardized difference values, along with item misfit analyses when determining which items and testlets are recommended for retirement.
Figure 3.3: Standardized difference z-scores for ELA 2019–2020 operational items.
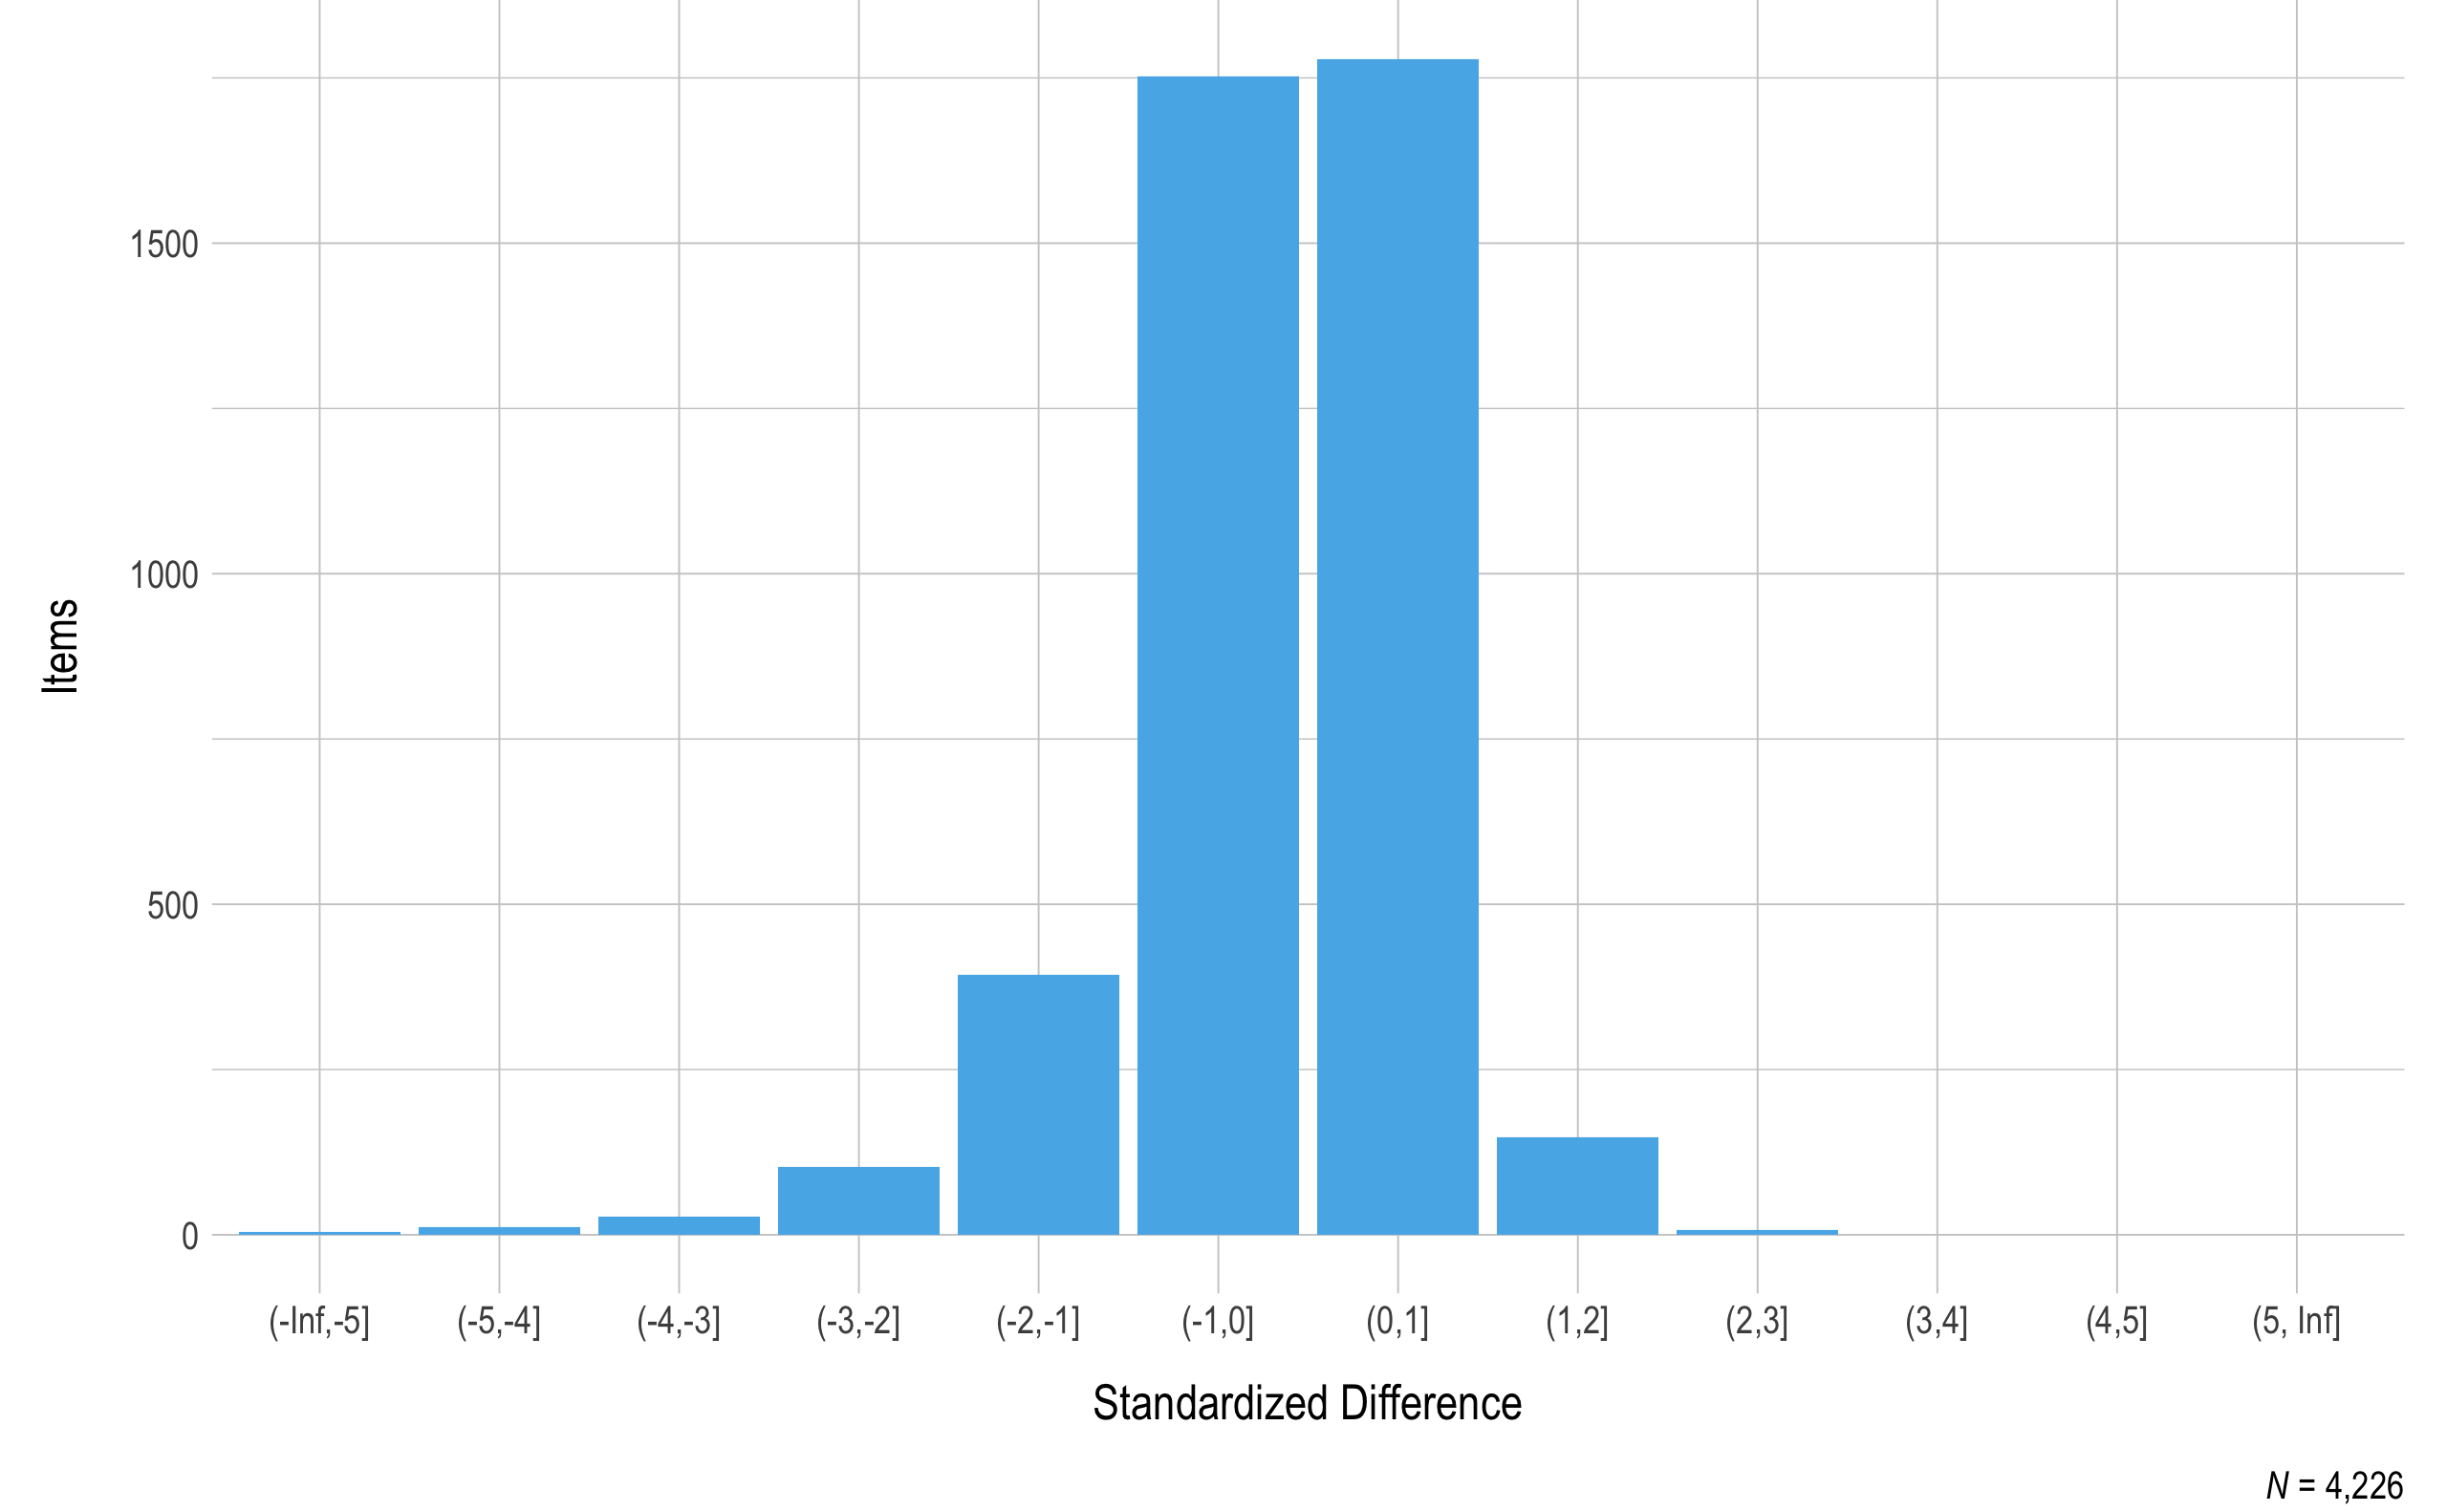
Note. Items with a sample size of less than 20 were omitted.
Figure 3.4: Standardized difference z-scores for mathematics 2019–2020 operational items.
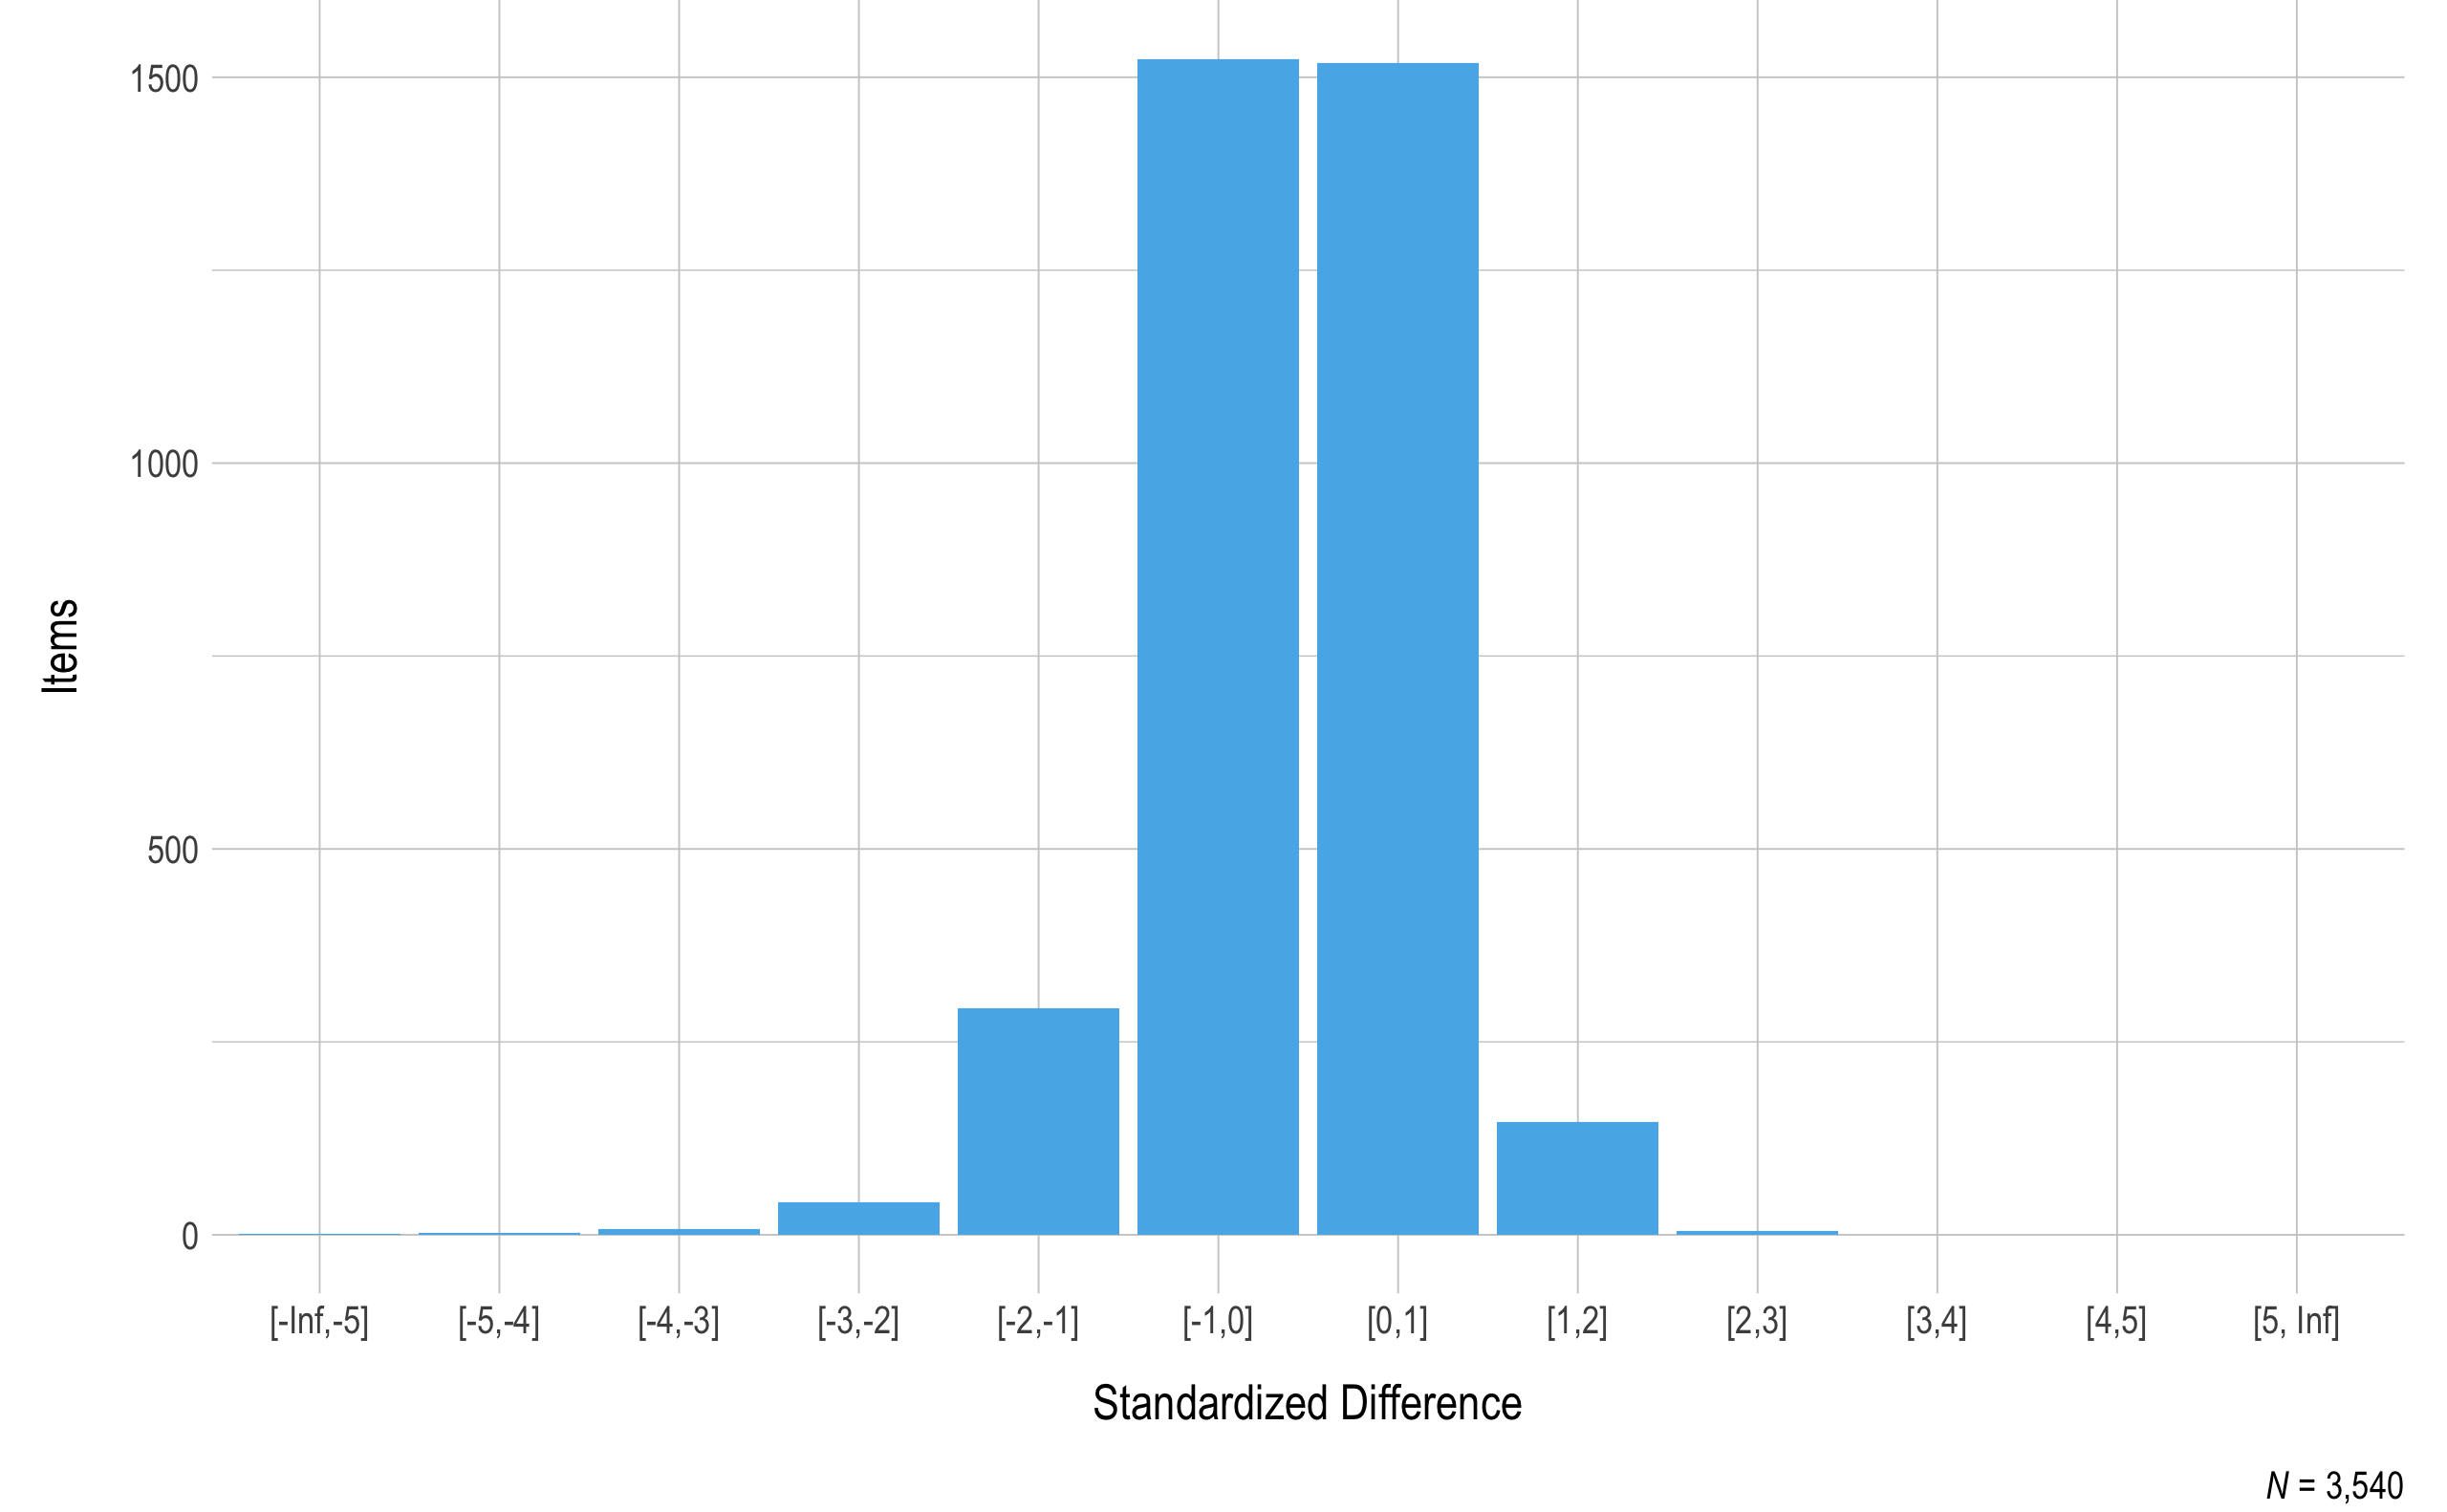
Note. Items with a sample size of less than 20 were omitted.
Figure 3.5 summarizes the standardized difference values for operational items for both ELA and mathematics by linkage level. Most items fell within two standard deviations of the mean of all items measuring the respective EE and linkage level, and the distributions are consistent across linkage levels.
Figure 3.5: Standardized difference z-scores for ELA and mathematics 2019–2020 operational items by linkage level.
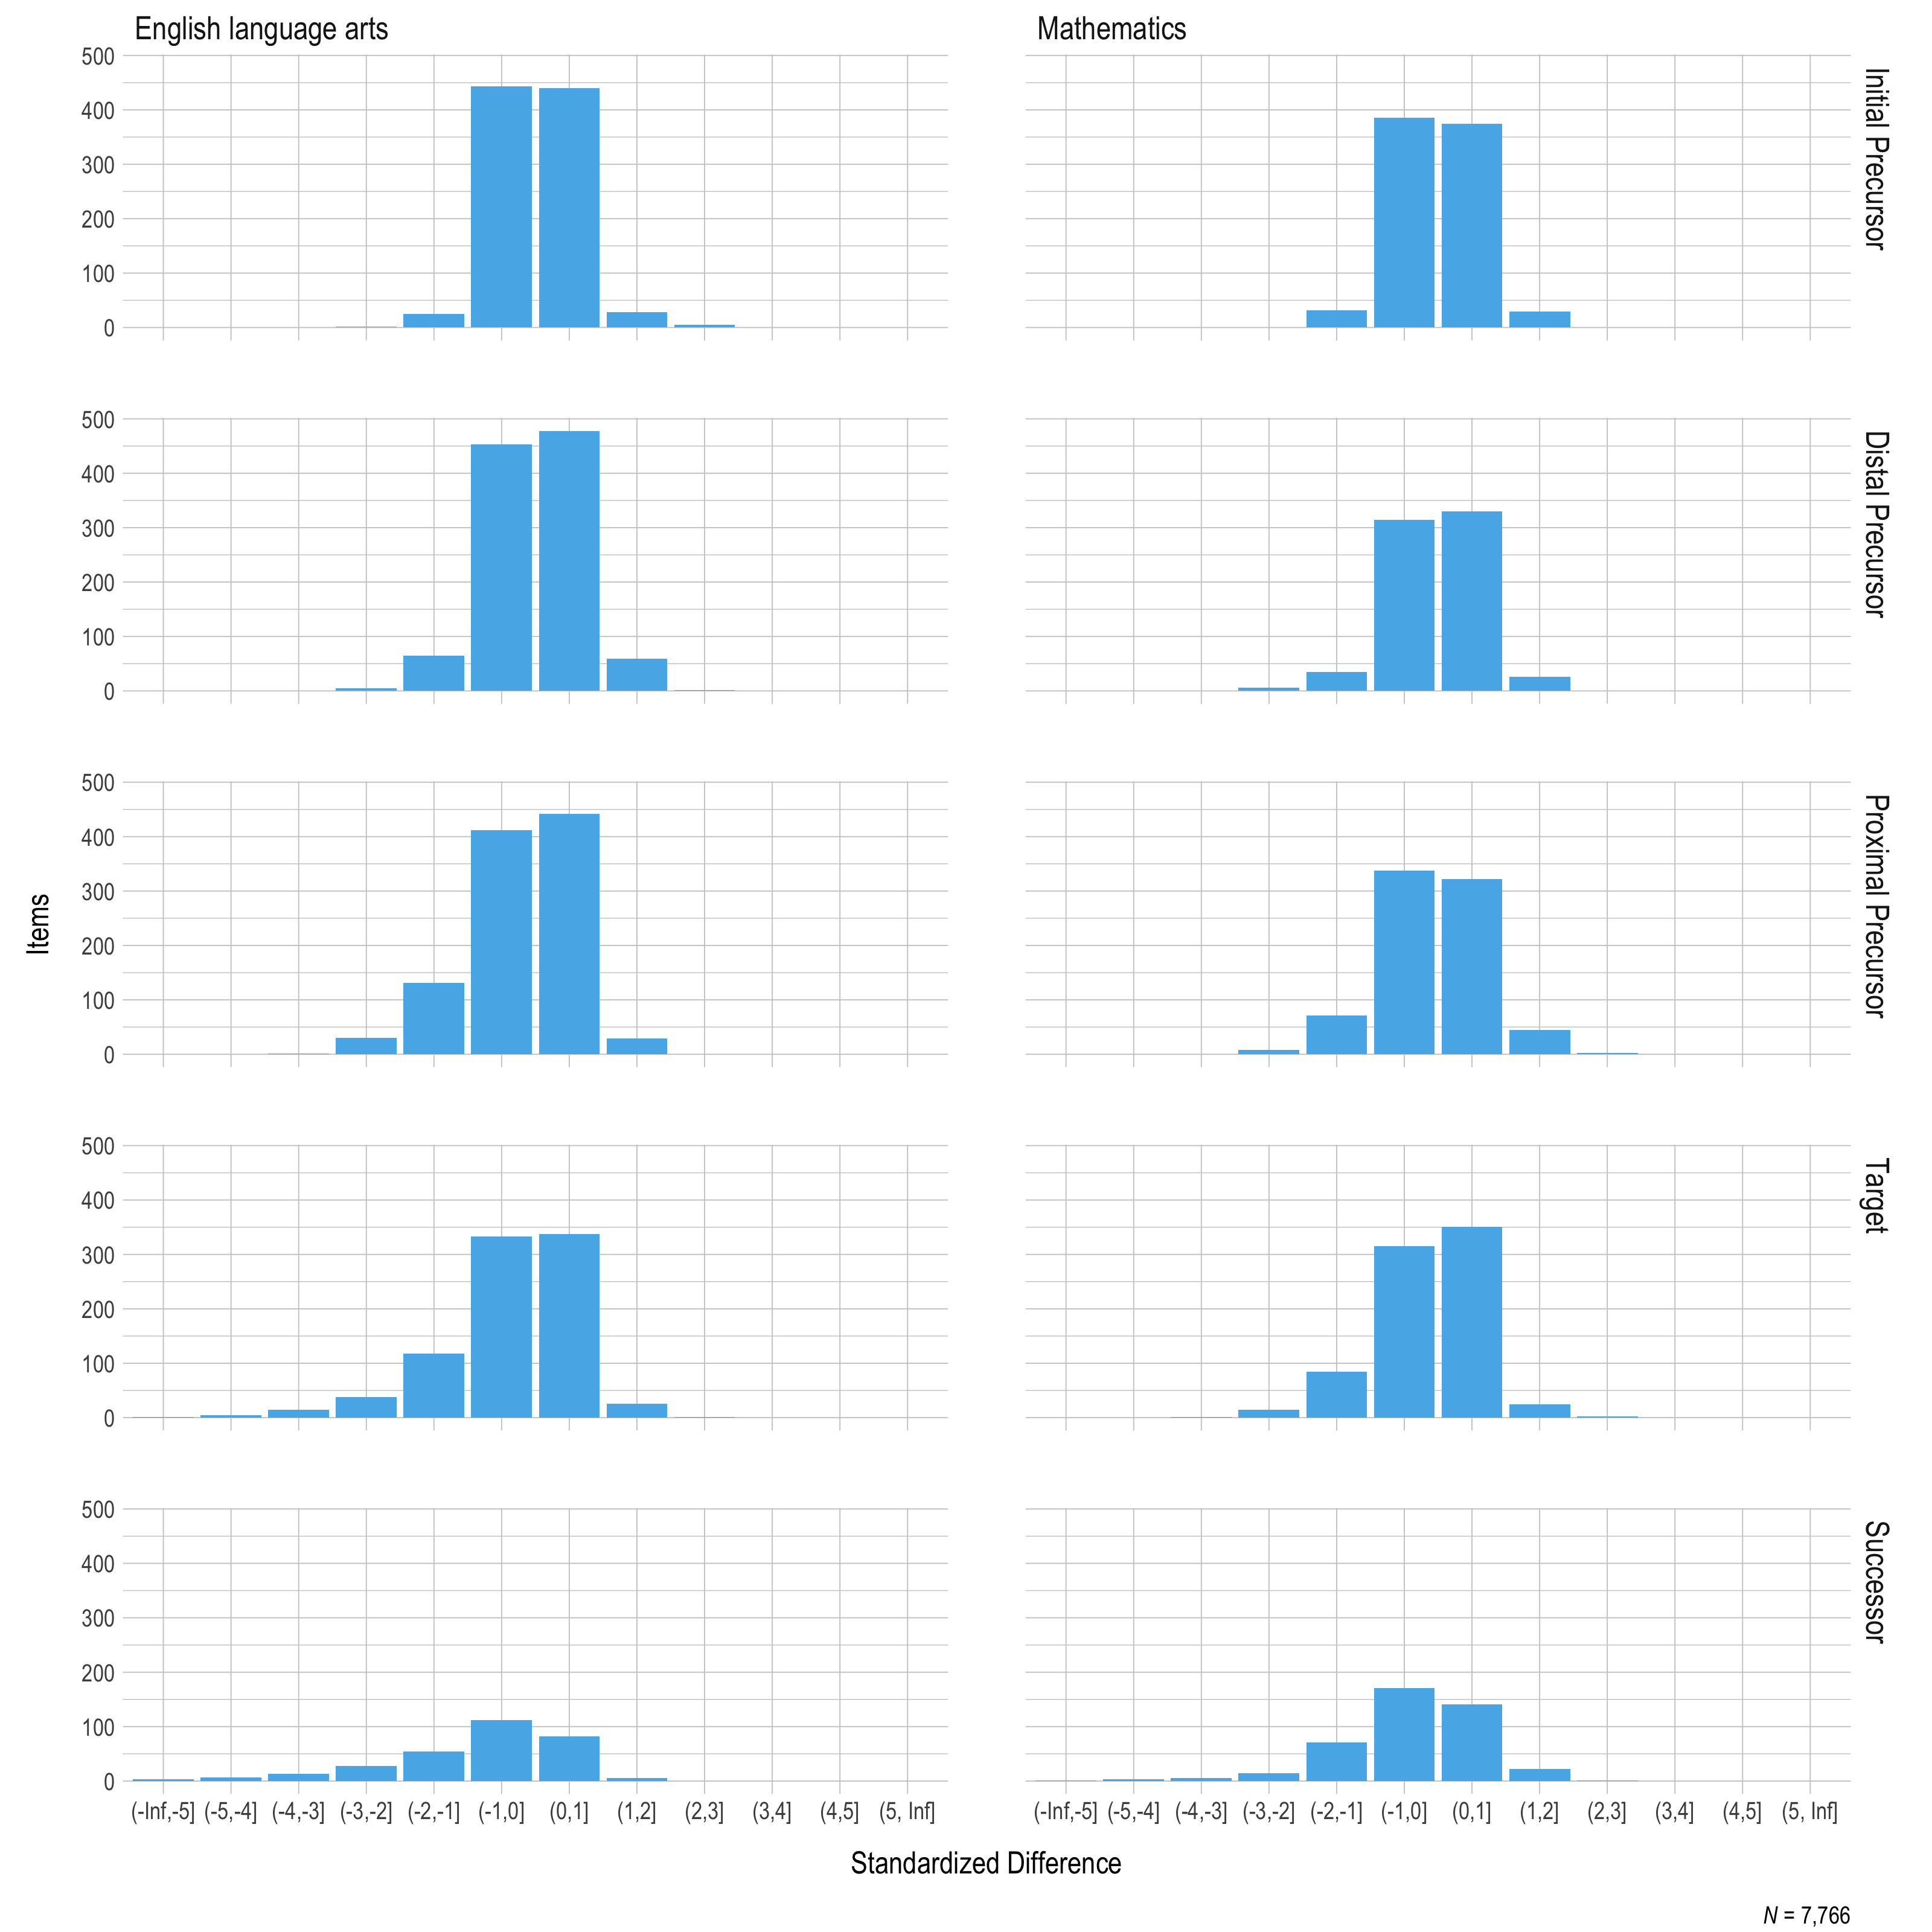
Note. Items with a sample size of less than 20 were omitted.
3.4 Field Testing
During the 2019–2020 academic year, DLM field tests were administered to evaluate item quality for EEs assessed at each grade level for ELA and mathematics. Field testing is conducted to deepen operational pools so that multiple testlets are available in the spring window, including making more content available at EEs and linkage levels that teachers administer to students the most. By deepening the operational pool, testlets can also be evaluated for retirement in instances where other testlets perform better.
A summary of prior field test events can be found in Summary of Results from the 2014 and 2015 Field Test Administrations of the Dynamic Learning Maps Alternate Assessment System (Clark, Karvonen, et al., 2016), and in Chapter 3 of the 2014–2015 Technical Manual—Year-End Model (Dynamic Learning Maps Consortium, 2016b) and subsequent annual DLM technical manual updates.
3.4.1 Description of Field Tests
Field tests were administered following completion of the operational assessment in the spring. Following completion of blueprint coverage requirements in each subject, a field test testlet was assigned for an EE that was assessed during the operational assessment at a linkage level equal or adjacent to the linkage level of the operational testlet. Adjacent linkage level assignment helps ensure both masters and non-masters complete the field test testlet, providing better psychometric data for item review. Additionally, adjacent linkage level data helps support future modeling work (see Chapter 5 of this manual).
Testlets were made available for spring field testing in 2019–2020 based on the availability of field test content for each EE/linkage level. Table 3.13 summarizes the total number of field test testlets by content area and grade level for 2019–2020. A total of 111 field test testlets were available across grades and content areas.
| Grade | English language arts (n) | Mathematics (n) |
|---|---|---|
| 3 | 9 | 9 |
| 4 | 3 | 4 |
| 5 | 4 | 2 |
| 6 | 7 | 6 |
| 7 | 6 | 8 |
| 8 | 4 | 5 |
| 9 | 8 | 8 |
| 10 | 7 | 7 |
| 11 | 5 | 9 |
Participation in spring field testing was not required, but teachers were encouraged to administer all available testlets to their students. The COVID-19 pandemic impacted field testing administration in the spring, and as a result, most students did not complete all testlets. Participation rates for ELA and mathematics in the spring 2020 window are shown in Table 3.14. In total, 11% of students in ELA and 13% of students in mathematics took at least one field test form. Additionally, 23% of field test testlets in the spring had a sample size of at least 20 students. These testlets will be reviewed in the upcoming 2020–2021 year.
| Subject | n | % |
|---|---|---|
| English language arts | 758 | 11.8 |
| Mathematics | 809 | 13.5 |
3.4.2 Field Test Results
Data collected during each field test are compiled, and statistical flags are implemented ahead of test development team review. Flagging criteria serve as a source of evidence for test development teams in evaluating item quality; however, final judgments are content based, taking into account the testlet as a whole and the underlying nodes in the DLM maps that the items were written to assess.
3.4.2.1 Item Flagging
Criteria used for item flagging during previous field test events were retained for 2019–2020. Items were flagged for review by test development teams if they met either of the following statistical criteria:
The item was too challenging, as indicated by a proportion correct (p-value) of less than .35. This value was selected as the threshold for flagging because most DLM items offer three response options, so a value of less than .35 may indicate less than chance selection of the option.
The item was significantly easier or harder than other items assessing the same EE and linkage level, as indicated by a weighted standardized difference greater than two standard deviations from the mean p-value for that EE and linkage level combination.
Field tests were assigned after meeting blueprint coverage in the instructionally embedded fall window. Because there are no blueprint coverage requirements for students in the fall, students did not participate in this field test, however, because students have access to these testlets, the field test results are included here. Reviewed items had a sample size of at least 20 observations. Figure 3.6 and Figure 3.7 summarize the p-values for items field-tested during the instructionally embedded fall window for ELA and mathematics, respectively. Most items fell above the .35 threshold for flagging. Test development teams for each subject reviewed items below the threshold.
Figure 3.6: Item p-values for 2019–2020 ELA Items Field-tested During the Instructionally Embedded Fall Window
Note. Items with a sample size of less than 20 were omitted.
Figure 3.7: Item p-values for 2019–2020 Mathematics Items Field-tested During the Instructionally Embedded Fall Window
Note. Items with a sample size of less than 20 were omitted.
Figure 3.8 and Figure 3.9 summarize the standardized difference values for items field-tested during the instructionally embedded fall window for ELA and mathematics, respectively. Most items fell within two standard deviations of the mean for the EE and linkage level. Items beyond the threshold were reviewed by test development teams for each subject.
Figure 3.8: Standardized Difference z-scores for 2019–2020 ELA Items Field-tested During the Instructionally Embedded Fall Window
Note. Items with a sample size of less than 20 were omitted.
Figure 3.9: Standardized Difference z-scores for 2019–2020 Mathematics Items Field-tested During the Instructionally Embedded Fall Window
Note. Items with a sample size of less than 20 were omitted.
3.4.2.2 Item Data Review Decision
Using the same procedures from prior field test windows, test development teams for each subject made four types of item-level decisions as they reviewed field test items flagged for either a p-value or a standardized difference value beyond the threshold:
- No changes made to item. Test development team decided item can go forward to operational assessment.
- Test development team identified concerns that required modifications. Modifications were clearly identifiable and were likely to improve item performance.
- Test development team identified concerns that required modifications. The content was worth preserving rather than rejecting. Item review may not have clearly pointed to specific edits that were likely to improve the item.
- Rejected item. Test development team determined the item was not worth revising.
For an item to be accepted as is, the test development team had to determine that the item was consistent with DLM item writing guidelines and the item was aligned to the node. An item or testlet was rejected completely if it was inconsistent with DLM item writing guidelines, if the EE and linkage level were covered by other testlets that had better performing items, or if there was no clear content-based revision to improve the item. In some instances, a decision to reject an item resulted in the rejection of the testlet, as well.
Common reasons for flagging an item for modification included items that were misaligned to the node, distractors that could be argued as partially correct, or unnecessary complexity in the language of the stem. After reviewing flagged items, the reviewers looked at all items rated as three or four within the testlet to help determine whether to retain or reject the testlet. Here, the test development team could elect to keep the testlet (with or without revision) or reject it. If a revision was needed, it was assumed the testlet needed field testing again. The entire testlet was rejected if the test development team determined the flagged items could not be adequately revised.
3.4.2.3 Results of Item Analysis and Test Development Team Review
A total of 43 ELA items and 37 mathematics items were flagged due to their p-values and/or standardized difference values. Test development teams reviewed all flagged items and their context within the testlet to identify possible reasons for the flag and determine whether an edit was likely to resolve the issue.
Of the 43 flagged ELA items, 36 (84%) items were accepted without revisions, and seven (16%) items were rejected and retired. Of the 37 flagged mathematics items, 15 (41%) items were accepted without revisions, 6 (16%) items were revised, and 16 (43%) items were rejected and retired.
3.5 Conclusion
During the 2019–2020 academic year, the year-end model blueprints were updated to reduce the number of EEs assessed in order to increase the number of items measuring each EE. The governance board also agreed to begin administering single-EE testlets in place of previous multi-EE testlets. The test development teams conducted events for both item writing and external review. Overall, over 500 testlets were written for ELA and mathematics. Additionally, following external review, 98% of ELA testlets and 100% of mathematics testlets were retained with no or minor changes. Of the content already in the operational pool, most items had p-values within two standard deviations of the mean for the EE and linkage level. Field testing in 2019–2020 focused on collecting data from students on new content to refresh the operational pool of testlets.