9 Validity Studies
The preceding chapters and the Dynamic Learning Maps® (DLM®) Alternate Assessment System 2014–2015 Technical Manual—Year-End Model (Dynamic Learning Maps Consortium, 2016b) provide evidence in support of the overall validity argument for results produced by the DLM assessment. This chapter presents additional evidence collected during 2019–2020 for three of the five critical sources of evidence described in Standards for Educational and Psychological Testing (American Educational Research Association et al., 2014): evidence based on test content, response process, and internal structure. Additional evidence can be found in Chapter 9 of the 2014–2015 Technical Manual—Year-End Model (Dynamic Learning Maps Consortium, 2016b) and the subsequent annual technical manual updates (Dynamic Learning Maps Consortium, 2017b, 2017c, 2018, 2019b).
9.1 Evidence Based on Test Content
Evidence based on test content relates to the evidence “obtained from an analysis of the relationship between the content of the test and the construct it is intended to measure” (American Educational Research Association et al., 2014, p. 14).
This section presents results from data collected during 2019–2020 regarding alignment of test content to content standards. For additional evidence based on test content, see Chapter 9 of the 2014–2015 Technical Manual—Year-End Model (Dynamic Learning Maps Consortium, 2016b).
9.1.1 Alignment
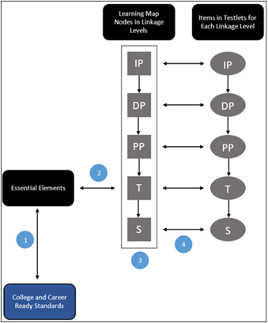
Aceri Partners conducted an external alignment study on the 2014–2015 DLM operational assessment system (Dynamic Learning Maps Consortium, 2016b; Flowers & Wakeman, 2016) to investigate the relationships between the content structures in the DLM Alternate Assessment System and assessment items. The alignment study focused on the following relationships (as illustrated by the corresponding numbers in Figure 9.1 below):
- College and Career Ready (CCR) Standards to Essential Elements (EEs)
- EE to Target level node(s)
- Vertical articulation of Linkage Levels associated with an EE
- DLM map nodes within a linkage level and assessment items
Figure 9.1: Relationships Investigated in the External Alignment Study
In February 2019, state education agencies participating in the year-end assessment model accepted blueprint revisions reducing the number of assessed Essential Elements (EEs) to support increasing the number of items measuring each EE. Assessment administration for the updated blueprint uses the existing single-EE testlets administered in states adopting the instructionally embedded model. DLM staff reanalyzed the data collected from the original study to reflect the changes to blueprint Essential Elements and the items administered. In ELA, a total of 79 testlets and 304 items were examined for alignment. In mathematics, 70 testlets and 192 items were evaluated. For a complete description of the original alignment study, see 2015–2016 Technical Manual Update—Integrated Model (Dynamic Learning Maps Consortium, 2017a).
In the original study, six content experts, three with ELA and three with mathematics expertise, served as panelists who evaluated the alignment of the DLM assessment system. Five panelists had experience teaching students with disabilities.
Content and performance centrality were the primary measures of alignment. Content centrality is a measure of the degree of fidelity between the content of the target (CCR, EE, Target level node, and linkage levels) and the linked target (EE, Target level node, linkage level, and items). Panelists rated each pair as having no link, a far link, or a near link. Performance centrality represents the degree to which the operational assessment item and the corresponding academic grade-level content target contain the same performance expectation. Panelists rated the degree of performance centrality between each pair as none, some, or all. If panelists identified a relationship that did not meet criteria for alignment (e.g., no link for content centrality), they provided additional feedback. When evaluating items, panelists used the DLM cognitive process dimension taxonomy to identify the category for the highest cognitive dimension required of the student when responding to the item.
The following sections provide a brief summary of findings from the external alignment study. Full results are provided in the updated technical report (Flowers & Wakeman, 2020).
9.1.1.1 Alignment of College and Career Ready Standards and Essential Elements
All EEs identified in the revised ELA and mathematics test blueprints were included in these analyses. Table 9.1 and Table 9.2 display the results of content centrality and performance centrality ratings, respectively. For content centrality, EEs were defined as “Met” if they were given a “Far” or “Near” rating. For performance centrality, EEs were defined as “Met” if they were given a “Some” or “All” rating. At the grade level (not reported in Table 1 or Table 2), ELA model grades 5 and 11-12 were slightly below the 80% threshold for content centrality and in the mathematics model, grades 3, 5, 6, and 8 fell below the 80% recommended threshold.
|
No
|
Far
|
Near
|
Met
|
||||||
|---|---|---|---|---|---|---|---|---|---|
| Subject | Total N | n | % | n | % | n | % | n | % |
| English language arts | 96 | 17 | 18.0 | 69 | 72.0 | 10 | 10.0 | 79 | 82.0 |
| Mathematics | 100 | 20 | 20.0 | 73 | 73.0 | 7 | 7.0 | 80 | 80.0 |
|
None
|
Some
|
All
|
Met
|
||||||
|---|---|---|---|---|---|---|---|---|---|
| Subject | Total N | n | % | n | % | n | % | n | % |
| English language arts | 96 | 9 | 9.0 | 75 | 78.0 | 12 | 13.0 | 87 | 91.0 |
| Mathematics | 100 | 26 | 26.0 | 57 | 57.0 | 17 | 17.0 | 74 | 74.0 |
9.1.1.2 Alignment of Essential Element and Target Level Nodes
Table 9.3 and Table 9.4 display the content and performance centrality of the alignment of EEs to target level node(s). The number of EEs in Table 9.3 and Table 9.4 are different from Table 9.1 and Table 9.2 because some EEs corresponded to more than one target level node. All EEs were rated as aligned to the target level nodes with most EEs rated as near the target level node. Similar results were found for performance centrality. All EEs were rated as meeting some or all of the performance expectations found in the target level node. These findings suggest a strong alignment between EEs and target level nodes.
|
No
|
Far
|
Near
|
Met
|
||||||
|---|---|---|---|---|---|---|---|---|---|
| Subject | Total N | n | % | n | % | n | % | n | % |
| English language arts | 96 | 0 | 0 | 4 | 4.0 | 92 | 96.0 | 96 | 100.0 |
| Mathematics | 145 | 0 | 0 | 28 | 19.0 | 117 | 81.0 | 145 | 100.0 |
|
None
|
Some
|
All
|
Met
|
||||||
|---|---|---|---|---|---|---|---|---|---|
| Subject | Total N | n | % | n | % | n | % | n | % |
| English language arts | 96 | 0 | 0 | 12 | 13.0 | 84 | 88.0 | 96 | 100.0 |
| Mathematics | 145 | 0 | 0 | 32 | 22.0 | 113 | 78.0 | 145 | 100.0 |
9.1.1.3 Vertical Articulation of Linkage Levels for each Essential Element
Panelists evaluated linkage levels to see if they reflected a progression of knowledge, skills, and understandings. Table 9.5 and Table 9.6 show the results of the vertical articulation of the linkage levels for the EEs at each grade level for ELA and mathematics. For ELA, 95 linkage levels were reviewed by panelists and 76 (80%) were rated as showing a clear progression from precursor to successor nodes. The low rating for 7th grade was due to panelists reporting that the Initial Precursor was not clearly part of the progression in the ordered nodes. For mathematics, 66 linkage levels were reviewed and 64 linkage levels (97%) were rated as demonstrating a clear progression in the ordered nodes.
|
Clear Progression
|
|||
|---|---|---|---|
| Grade | Total N | n | % |
| 3 | 10 | 9 | 90.0 |
| 4 | 11 | 9 | 81.8 |
| 5 | 10 | 8 | 80.0 |
| 6 | 11 | 9 | 81.8 |
| 7 | 13 | 7 | 53.8 |
| 8 | 13 | 10 | 76.9 |
| 9–10 | 14 | 12 | 85.7 |
| 11–12 | 13 | 12 | 92.3 |
| Total | 95 | 76 | 80.0 |
|
Clear Progression
|
|||
|---|---|---|---|
| Grade | Total N | n | % |
| 3 | 8 | 8 | 100.0 |
| 4 | 8 | 7 | 87.5 |
| 5 | 8 | 8 | 100.0 |
| 6 | 7 | 6 | 85.7 |
| 7 | 6 | 6 | 100.0 |
| 8 | 8 | 8 | 100.0 |
| 9 | 7 | 7 | 100.0 |
| 10 | 8 | 8 | 100.0 |
| 11 | 6 | 6 | 100.0 |
| Total | 66 | 64 | 97.0 |
9.1.1.4 Alignment of Learning Map Nodes within a Linkage Level and Assessment Items
Table 9.7 and Table 9.8 report the content and performance centrality ratings for the linkage level nodes to the assessment items, respectively. Overall, 96% of ELA and 100% of mathematics items were rated as having far or near content centrality to the corresponding linkage level. Similarly, the performance centrality ratings indicated that almost all items maintained the performance expectations found in the corresponding linkage level node.
|
No
|
Far
|
Near
|
Met
|
||||||
|---|---|---|---|---|---|---|---|---|---|
| Subject | Total N | n | % | n | % | n | % | n | % |
| English language arts | 304 | 11 | 4.0 | 25 | 8.0 | 268 | 88.0 | 293 | 96.0 |
| Mathematics | 192 | 0 | 0.0 | 13 | 7.0 | 179 | 93.0 | 192 | 100.0 |
|
None
|
Some
|
All
|
Met
|
||||||
|---|---|---|---|---|---|---|---|---|---|
| Subject | Total N | n | % | n | % | n | % | n | % |
| English language arts | 304 | 8 | 3.0 | 33 | 11.0 | 263 | 87.0 | 296 | 97.0 |
| Mathematics | 186 | 0 | 0.0 | 6 | 3.0 | 180 | 97.0 | 186 | 100.0 |
Table 9.9 shows the percentage of items rated with each of the cognitive process dimensions (CPD) used by the DLM assessments for ELA and mathematics. Most ELA items were rated at the respond or understand level, and the mathematics items rated mostly at the remember to analyze CPD levels. Most items were located in the middle of the CPD distribution. These results suggest that the items cover a wide range of cognitive complexity.
| Cognitive Process Dimension | English language arts % (n = 278) | Mathematics % (n = 248) |
|---|---|---|
| Pre-intentional | 0 | 0 |
| Attend | 2 | 0 |
| Respond | 26 | 0 |
| Replicate | 0 | 2 |
| Remember | 24 | 20 |
| Understand | 47 | 34 |
| Apply | 1 | 25 |
| Analyze | 1 | 15 |
| Evaluate | 0 | 4 |
| Create | 0 | 0 |
9.1.1.5 Summary
The updated findings provide evidence that the updated blueprint for the year-end model maintains alignment to ELA and mathematics grade-level academic content standards for students with the most significant cognitive disabilities. All content structures and items demonstrated adequate to strong linkage to the internal structure of the DLM system, beginning with the alignment between the college and career ready standards and the EEs and ending with the learning map nodes and items. DLM staff designed a method of extending college and career ready standards to provide access to academic content for all students with significant cognitive disabilities. The linkage levels provide a structure for examining students’ progression in ELA and mathematics.
9.2 Evidence Based on Response Processes
The study of test takers’ response processes provides evidence about the fit between the test construct and the nature of how students actually experience test content (American Educational Research Association et al., 2014). Due to the COVID-19 pandemic, teacher survey responses and test administration observations were significantly reduced from prior years. The data collected from the limited samples of survey responses and teacher administration observations are not included in this chapter as they may not accurately represent the full DLM teacher population. Information on the number of test administration observations collected as well as the number of writing samples collected for interrater agreement is presented in this section. For additional evidence based on response process, including studies on student and teacher behaviors during testlet administration and evidence of fidelity of administration, see Chapter 9 of the 2014–2015 Technical Manual—Year-End Model (Dynamic Learning Maps Consortium, 2016b).
9.2.1 Test Administration Observations
Prior to the onset of the COVID-19 pandemic, test administration observations were conducted in multiple states during 2019–2020 to further understand student response processes. Students’ typical test administration process with their actual test administrator was observed. Test administration observations were collected by state and local education agency staff.
Consistent with previous years, the DLM Consortium used a test administration observation protocol to gather information about how educators in the consortium states deliver testlets to students with the most significant cognitive disabilities. This protocol gave observers, regardless of their role or experience with DLM assessments, a standardized way to describe how DLM testlets were administered. The test administration observation protocol captured data about student actions (e.g., navigation, responding), educator assistance, variations from standard administration, engagement, and barriers to engagement. The observation protocol was used only for descriptive purposes; it was not used to evaluate or coach educators or to monitor student performance. Most items on the protocol were a direct report of what was observed, such as how the test administrator prepared for the assessment and what the test administrator and student said and did. One section of the protocol asked observers to make judgments about the student’s engagement during the session.
In 2019–2020, there were 223 observations collected in six states.
9.2.2 Interrater Agreement of Writing Sample Scoring
All students are assessed on writing EEs as part of the ELA blueprint. Teachers administer writing testlets at two levels: emergent and conventional. Emergent testlets measure nodes at the Initial Precursor and Distal Precursor levels, while conventional testlets measure nodes at the Proximal Precursor, Target, and Successor levels. All writing testlets include items that require teachers to evaluate students’ writing processes; some testlets also include items that require teachers to evaluate students’ writing samples. Evaluation of students’ writing samples does not use a high-inference process common in large-scale assessment, such as applying analytic or holistic rubrics. Instead, writing samples are evaluated for text features that are easily perceptible to a fluent reader and require little or no inference on the part of the rater (e.g., correct syntax, orthography). The test administrator is presented with an onscreen selected-response item and is instructed to choose the option(s) that best matches the student’s writing sample. Only test administrators rate writing samples, and their item responses are used to determine students’ mastery of linkage levels for writing and some language EEs on the ELA blueprint. We annually collect student writing samples to evaluate how reliably teachers rate students’ writing samples. However, due to the COVID-19 pandemic, interrater reliability ratings for writing samples collected during the 2019–2020 administration were postponed until 2021. For a complete description of writing testlet design and scoring, including example items, see Chapter 3 of the 2015–2016 Technical Manual Update—Year-End Model (Dynamic Learning Maps Consortium, 2017b)
During the spring 2020 administration, teachers were asked to submit student writing samples within Educator Portal. Requested submissions included papers that students used during testlet administration, copies of student writing samples, or printed photographs of student writing samples. To allow the sample to be matched with test administrator response data from the spring 2020 administration, each sample was submitted with limited information to enable matching to the observed educator ratings.
A total of 379 student writing samples were submitted from districts in eight states. In several grades, the emergent writing testlet does not include any tasks that evaluate the writing sample; therefore, emergent samples submitted for these grades are not eligible to be included in the interrater reliability analysis (e.g., grade 3 emergent writing samples). Additionally, writing samples that could not be matched with student data were excluded (e.g., student name or identifier was not provided). These exclusion criteria resulted in the availability of 226 writing samples for evaluation of interrater agreement, which will be conducted in 2021.
9.3 Evidence Based on Internal Structure
Analyses of an assessment’s internal structure indicate the degree to which “relationships among test items and test components conform to the construct on which the proposed test score interpretations are based” (American Educational Research Association et al., 2014, p. 16). Given the heterogeneous nature of the DLM student population, statistical analyses can examine whether particular items function differently for specific subgroups (e.g., male versus female). Additional evidence based on internal structure is provided across the linkage levels that form the basis of reporting.
9.3.1 Evaluation of Item-Level Bias
Differential item functioning (DIF) addresses the challenge created when some test items are “asked in such a way that certain groups of examinees who are knowledgeable about the intended concepts are prevented from showing what they know” (Camilli & Shepard, 1994, p. 1). DIF analyses can uncover internal inconsistency if particular items function differently in a systematic way for identifiable subgroups of students (American Educational Research Association et al., 2014). While identification of DIF does not always indicate weakness in a test item, it can point to construct-irrelevant variance, posing considerations for validity and fairness.
9.3.1.1 Method
DIF analyses for 2020 followed the same procedure used in previous years and examined ethnicity in addition to gender. Analyses included data from 2015–2016 through 2018–2019 DIF analyses are conducted on the sample of data used to update the model calibration, which uses data through the previous operational assessment. See Chapter 5 of this manual for more information. to flag items for evidence of DIF. Items were selected for inclusion in the DIF analyses based on minimum sample-size requirements for the two gender subgroups: male and female; and five ethnicity subgroups: white, black, Indian, Asian, and multiple ethnicities.
The DLM student population is unbalanced in both gender and ethnicity. The number of female students responding to items is smaller than the number of male students by a ratio of approximately 1:2. Similarly, the number of non-white students responding to items is smaller than the number of white students by a ratio of approximately 1:2. Therefore, a threshold for item inclusion was retained from previous years whereby the focal group must have at least 100 students responding to the item. The threshold of 100 was selected to balance the need for a sufficient sample size in the focal group with the relatively low number of students responding to many DLM items. Writing items were excluded from the DIF analyses described here because they include non-independent response options. See Chapter 3 of the 2016–2017 Technical Manual Update—Year-End Model (Dynamic Learning Maps Consortium, 2017c) for more information on the process of scoring writing items.
Consistent with previous years, additional criteria were included to prevent estimation errors. Items with an overall proportion correct (p-value) greater than .95 or less than .05 were removed from the analyses. Items for which the p-value for one gender or ethnicity group was greater than .97 or less than .03 were also removed from the analyses.
Using the above criteria for inclusion, 1,348 (43%) items were selected for gender, and 761 (25%) items were selected for at least one ethnicity group comparison. The number of items evaluated by grade and subject for gender ranged from 49 in grade 5 ELA to 118 in grade 8 mathematics. The number of items evaluated by grade and subject for ethnicity ranged from 10 in grade 3 ELA to 72 in grade 8 mathematics. Because there are a total of seven ethnicity groups that students can be categorized in for DLM assessments, See Chapter 7 of this manual for a summary of participation by ethnicity and other demographic variables. there are up to six comparisons that can be made for each item, with the White ethnic group as the reference group and each of the other six ethnic groups (i.e., African American, Asian, American Indian, Native Hawaiian or Pacific Islander, Alaska Native, two or more races) as the focal group. Across all items, this results in 18,522 possible comparisons. Using the inclusion criteria specified above, 1,221 (7%) item and focal group comparisons were selected for analysis. Overall, 425 items were evaluated for one ethnic groups, 242 items were evaluated for two ethnic groups, 64 items were evaluated for three ethnic groups, and 30 items were evaluated for four ethnic groups. Table 9.10 shows the number of items that were evaluated for each ethnic focal group. Across all gender and ethnicity comparisons, sample sizes for each comparison ranged from 260 to 5,113 for gender and from 416 to 4,160 for ethnicity.
| Focal Group | Items (n) |
|---|---|
| Asian | 90 |
| African American | 761 |
| American Indian | 34 |
| Two or more races | 336 |
Of the 1,785 items that were not included in the DIF analysis for gender, 1,658 (93%) had a focal group sample size of less than 100, 48 (3%) had an item p-value greater than .95, and 79 (4%) had a subgroup p-value greater than .97. A total of 2,326 items were not included in the DIF analysis for ethnicity for any of the subgroups. Of the 17,301 item and focal group comparisons that were not included in the DIF analysis for ethnicity, 17,206 (99%) had a focal group sample size of less than 100, 8 (< 1%) had an item p-value greater than .95, and 87 (1%) had a subgroup p-value greater than .97. Table 9.11 and Table 9.12 show the number and percent of items that did not meet each inclusion criteria for gender and ethnicity, respectively, by subject and the linkage level the items assess. The majority of non-included comparisons come from ELA for both gender (n = 1,101; 62%) and ethnicity (n = 9,089; 53%).
|
Sample
Size |
Item
Proportion Correct |
Subgroup
Proportion Correct |
||||
|---|---|---|---|---|---|---|
| Subject and Linkage Level | n | % | n | % | n | % |
| English language arts | ||||||
| Initial Precursor | 144 | 14.1 | 0 | 0.0 | 0 | 0.0 |
| Distal Precursor | 288 | 28.2 | 0 | 0.0 | 3 | 5.7 |
| Proximal Precursor | 292 | 28.6 | 1 | 3.6 | 9 | 17.0 |
| Target | 153 | 15.0 | 7 | 25.0 | 20 | 37.7 |
| Successor | 143 | 14.0 | 20 | 71.4 | 21 | 39.6 |
| Mathematics | ||||||
| Initial Precursor | 119 | 18.7 | 0 | 0.0 | 0 | 0.0 |
| Distal Precursor | 109 | 17.1 | 0 | 0.0 | 3 | 11.5 |
| Proximal Precursor | 121 | 19.0 | 12 | 60.0 | 5 | 19.2 |
| Target | 139 | 21.8 | 3 | 15.0 | 12 | 46.2 |
| Successor | 150 | 23.5 | 5 | 25.0 | 6 | 23.1 |
|
Sample
Size |
Item
Proportion Correct |
Subgroup
Proportion Correct |
||||
|---|---|---|---|---|---|---|
| Subject and Linkage Level | n | % | n | % | n | % |
| English language arts | ||||||
| Initial Precursor | 1,542 | 17.1 | 0 | 0.0 | 0 | 0.0 |
| Distal Precursor | 2,276 | 25.2 | 0 | 0.0 | 3 | 5.5 |
| Proximal Precursor | 2,414 | 26.7 | 0 | 0.0 | 14 | 25.5 |
| Target | 1,542 | 17.1 | 2 | 33.3 | 16 | 29.1 |
| Successor | 1,254 | 13.9 | 4 | 66.7 | 22 | 40.0 |
| Mathematics | ||||||
| Initial Precursor | 1,759 | 21.5 | 0 | 0.0 | 1 | 3.1 |
| Distal Precursor | 1,429 | 17.5 | 0 | 0.0 | 6 | 18.8 |
| Proximal Precursor | 1,760 | 21.5 | 0 | 0.0 | 7 | 21.9 |
| Target | 1,747 | 21.4 | 0 | 0.0 | 11 | 34.4 |
| Successor | 1,483 | 18.1 | 2 | 100.0 | 7 | 21.9 |
For each item, logistic regression was used to predict the probability of a correct response, given group membership and performance in the subject. Specifically, the logistic regression equation for each item included a matching variable comprised of the student’s total linkage levels mastered in the subject of the item and a group membership variable, with the reference group (i.e., males for gender, White for ethnicity) coded as 1 and the focal group (i.e., females for gender; African American, Asian, American Indian, Native Hawaiian or Pacific Islander, Alaska Native, or two or more races for ethnicity) coded as 0. An interaction term was included to evaluate whether non-uniform DIF was present for each item (Swaminathan & Rogers, 1990); the presence of non-uniform DIF indicates that the item functions differently because of the interaction between total linkage levels mastered and the student’s group (i.e., gender or ethnic group). When non-uniform DIF is present, the group with the highest probability of a correct response to the item differs along the range of total linkage levels mastered, thus one group is favored at the low end of the spectrum and the other group is favored at the high end.
Three logistic regression models were fitted for each item:
\[\begin{align} \text{M}_0\text{: } \text{logit}(\pi_i) &= \beta_0 + \beta_1\text{X} \tag{9.1} \\ \text{M}_1\text{: } \text{logit}(\pi_i) &= \beta_0 + \beta_1\text{X} + \beta_2G \tag{9.2} \\ \text{M}_2\text{: } \text{logit}(\pi_i) &= \beta_0 + \beta_1\text{X} + \beta_2G + \beta_3\text{X}G\tag{9.3}; \end{align}\]where \(\pi_i\) is the probability of a correct response to the item for group \(i\), \(\text{X}\) is the matching criterion, \(G\) is a dummy coded grouping variable (0 = reference group, 1 = focal group), \(\beta_0\) is the intercept, \(\beta_1\) is the slope, \(\beta_2\) is the group-specific parameter, and \(\beta_3\) is the interaction term.
Because of the number of items evaluated for DIF, Type I error rates were susceptible to inflation. The incorporation of an effect-size measure can be used to distinguish practical significance from statistical significance by providing a metric of the magnitude of the effect of adding group and interaction terms to the regression model.
For each item, the change in the Nagelkerke pseudo \(R^2\) measure of effect size was captured, from \(M_0\) to \(M_1\) or \(M_2\), to account for the effect of the addition of the group and interaction terms to the equation. All effect-size values were reported using both the Zumbo and Thomas (1997) and Jodoin and Gierl (2001) indices for reflecting a negligible, moderate, or large effect. The Zumbo and Thomas thresholds for classifying DIF effect size are based on Cohen’s (1992) guidelines for identifying a small, medium, or large effect. The thresholds for each level are .13 and .26; values less than .13 have a negligible effect, values between .13 and .26 have a moderate effect, and values of .26 or greater have a large effect. The Jodoin and Gierl thresholds are more stringent, with lower threshold values of .035 and .07 to distinguish between negligible, moderate, and large effects.
9.3.1.2 Results
9.3.1.2.1 Uniform DIF Model
A total of 127 items for gender were flagged for evidence of uniform DIF when comparing \(\text{M}_0\) to \(\text{M}_1\). Additionally, 93 item and focal group combinations across 85 items were flagged for evidence of uniform DIF. Table 9.13 and Table 9.14 summarize the total number of combinations flagged for evidence of uniform DIF by subject and grade for gender and ethnicity, respectively. The percentage of combinations flagged for uniform DIF ranged from 5% to 16% for gender and 4% to 17% for ethnicity.
| Grade | Items flagged (n) | Total items (N) | Items flagged (%) | Items with moderate or large effect size (n) |
|---|---|---|---|---|
| English language arts | ||||
| 3 | 4 | 72 | 5.6 | 0 |
| 4 | 13 | 84 | 15.5 | 0 |
| 5 | 3 | 49 | 6.1 | 0 |
| 6 | 7 | 75 | 9.3 | 0 |
| 7 | 7 | 68 | 10.3 | 0 |
| 8 | 7 | 68 | 10.3 | 1 |
| 9–10 | 6 | 61 | 9.8 | 0 |
| 11–12 | 9 | 55 | 16.4 | 0 |
| Mathematics | ||||
| 3 | 9 | 79 | 11.4 | 0 |
| 4 | 6 | 72 | 8.3 | 0 |
| 5 | 5 | 96 | 5.2 | 0 |
| 6 | 6 | 92 | 6.5 | 0 |
| 7 | 4 | 69 | 5.8 | 0 |
| 8 | 10 | 118 | 8.5 | 0 |
| 9 | 10 | 92 | 10.9 | 0 |
| 10 | 9 | 103 | 8.7 | 0 |
| 11 | 12 | 95 | 12.6 | 0 |
| Grade | Items flagged (n) | Total items (N) | Items flagged (%) | Items with moderate or large effect size (n) |
|---|---|---|---|---|
| English language arts | ||||
| 3 | 1 | 10 | 10.0 | 0 |
| 4 | 7 | 90 | 7.8 | 0 |
| 5 | 6 | 36 | 16.7 | 0 |
| 6 | 7 | 76 | 9.2 | 0 |
| 7 | 3 | 54 | 5.6 | 0 |
| 8 | 6 | 72 | 8.3 | 0 |
| 9–10 | 7 | 80 | 8.8 | 0 |
| 11–12 | 3 | 51 | 5.9 | 0 |
| Mathematics | ||||
| 3 | 6 | 78 | 7.7 | 0 |
| 4 | 4 | 55 | 7.3 | 0 |
| 5 | 6 | 99 | 6.1 | 0 |
| 6 | 6 | 97 | 6.2 | 0 |
| 7 | 4 | 34 | 11.8 | 0 |
| 8 | 8 | 111 | 7.2 | 0 |
| 9 | 7 | 111 | 6.3 | 0 |
| 10 | 8 | 76 | 10.5 | 0 |
| 11 | 4 | 91 | 4.4 | 0 |
For gender, using the Zumbo and Thomas (1997) effect-size classification criteria, all combinations were found to have a negligible effect-size change after the gender term was added to the regression equation. When using the Jodoin and Gierl (2001) effect-size classification criteria, all but one combination were found to have a negligible effect-size change after the gender term was added to the regression equation.
The results of the DIF analyses for ethnicity were similar to those for gender. When using the Zumbo and Thomas (1997) effect-size classification criteria, all combinations were found to have a negligible effect-size change after the ethnicity term was added to the regression equation. Similarly, when using the Jodoin and Gierl (2001) effect-size classification criteria, all combinations were found to have a negligible effect-size change after the ethnicity term was added to the regression equation.
Table 9.15 provides information about the flagged items with a non-negligible effect-size change after the addition of the group term, as represented by a value of B (moderate) or C (large). The \(\beta_2G\) values in Table 9.15 indicate which group was favored on the item after accounting for total linkage levels mastered, with positive values indicating that the focal group had a higher probability of success on the item and negative values indicating that the focal group had a lower probability of success on the item. The focal group was favored on zero combinations.
| Item ID | Focal | Grade | EE | \(\chi^2\) | \(p\)-value | \(\beta_2G\) | \(R^2\) | Z&T* | J&G* |
|---|---|---|---|---|---|---|---|---|---|
| English language arts | |||||||||
| 32251 | Female | 8 | ELA.EE.L.8.5.a | 8.93 | .003 | −0.78 | .038 | A | B |
| Note. EE = Essential Element; Z&T = Zumbo & Thomas; J&G = Jodoin & Gierl. | |||||||||
| * Effect-size measure. | |||||||||
9.3.1.2.2 Combined Model
A total of 146 items were flagged for evidence of DIF when both the gender and interaction terms were included in the regression equation, as shown in equation (9.3). Additionally, 154 item and focal group combinations across 135 items were flagged for evidence of DIF when both the ethnicity and interaction terms were included in the regression equation. Table 9.16 and Table 9.17 summarize the number of combinations flagged by subject and grade. The percentage of combinations flagged ranged from 3% to 17% for gender and 4% to 25% for ethnicity.
| Grade | Items flagged (n) | Total items (N) | Items flagged (%) | Items with moderate or large effect size (n) |
|---|---|---|---|---|
| English language arts | ||||
| 3 | 2 | 72 | 2.8 | 0 |
| 4 | 11 | 84 | 13.1 | 0 |
| 5 | 7 | 49 | 14.3 | 0 |
| 6 | 7 | 75 | 9.3 | 0 |
| 7 | 9 | 68 | 13.2 | 0 |
| 8 | 3 | 68 | 4.4 | 1 |
| 9–10 | 10 | 61 | 16.4 | 0 |
| 11–12 | 6 | 55 | 10.9 | 0 |
| Mathematics | ||||
| 3 | 5 | 79 | 6.3 | 0 |
| 4 | 12 | 72 | 16.7 | 1 |
| 5 | 10 | 96 | 10.4 | 1 |
| 6 | 6 | 92 | 6.5 | 1 |
| 7 | 4 | 69 | 5.8 | 0 |
| 8 | 14 | 118 | 11.9 | 0 |
| 9 | 10 | 92 | 10.9 | 1 |
| 10 | 14 | 103 | 13.6 | 1 |
| 11 | 16 | 95 | 16.8 | 0 |
| Grade | Items flagged (n) | Total items (N) | Items flagged (%) | Items with moderate or large effect size (n) |
|---|---|---|---|---|
| English language arts | ||||
| 3 | 1 | 10 | 10.0 | 0 |
| 4 | 12 | 90 | 13.3 | 0 |
| 5 | 9 | 36 | 25.0 | 0 |
| 6 | 8 | 76 | 10.5 | 0 |
| 7 | 4 | 54 | 7.4 | 0 |
| 8 | 11 | 72 | 15.3 | 0 |
| 9–10 | 18 | 80 | 22.5 | 0 |
| 11–12 | 10 | 51 | 19.6 | 0 |
| Mathematics | ||||
| 3 | 14 | 78 | 17.9 | 0 |
| 4 | 3 | 55 | 5.5 | 0 |
| 5 | 11 | 99 | 11.1 | 0 |
| 6 | 11 | 97 | 11.3 | 0 |
| 7 | 5 | 34 | 14.7 | 0 |
| 8 | 8 | 111 | 7.2 | 0 |
| 9 | 20 | 111 | 18.0 | 0 |
| 10 | 3 | 76 | 3.9 | 0 |
| 11 | 6 | 91 | 6.6 | 0 |
Using the Zumbo and Thomas (1997) effect-size classification criteria, all combinations were found to have a negligible effect-size change after the gender and interaction terms were added to the regression equation. When using the Jodoin and Gierl (2001) effect-size classification criteria, all but six combinations were found to have a negligible effect-size change after the gender and interaction terms were added to the regression equation.
The results of the DIF analyses for ethnicity were similar to those for gender. When using the Zumbo and Thomas (1997) effect-size classification criteria, all combinations were found to have a negligible effect-size change after the ethnicity and interaction terms were added to the regression equation. Similarly, when using the Jodoin and Gierl (2001) effect-size classification criteria, all combinations were found to have a negligible effect-size change after the ethnicity and interaction terms were added to the regression equation.
Information about the flagged items with a non-negligible change in effect size after adding both the group and interaction term is summarized in Table 9.18, where B indicates a moderate effect size, and C a large effect size.
In total, six combinations had a moderate effect size.
The \(\beta_3\text{X}G\) values in Table 9.18 indicate which group was favored at lower and higher numbers of linkage levels mastered. A total of 3 combinations favored the focal group at higher numbers of total linkage levels mastered and the reference group at lower numbers of total linkage levels mastered.
| Item ID | Focal | Grade | EE | \(\chi^2\) | \(p\)-value | \(\beta_2G\) | \(\beta_3\text{X}G\) | \(R^2\) | Z&T* | J&G* |
|---|---|---|---|---|---|---|---|---|---|---|
| English language arts | ||||||||||
| 32251 | Female | 8 | ELA.EE.L.8.5.a | 9.61 | .008 | 0.39 | −0.03 | .040 | A | B |
| Math | ||||||||||
| 12516 | Female | 4 | M.EE.4.MD.2.d | 20.66 | < .001 | −0.89 | 0.60 | .041 | A | B |
| 8272 | Female | 5 | M.EE.5.MD.3 | 10.84 | .004 | 1.96 | −0.15 | .051 | A | B |
| 37348 | Female | 6 | M.EE.6.NS.1 | 9.07 | .011 | 1.31 | −0.27 | .036 | A | B |
| 41185 | Female | 9 | M.EE.HS.N.CN.2.a | 8.81 | .012 | −3.27 | 0.28 | .044 | A | B |
| 21354 | Female | 10 | M.EE.HS.S.ID.4 | 11.85 | .003 | −0.77 | 0.17 | .035 | A | B |
| Note. EE = Essential Element; Z&T = Zumbo & Thomas; J&G = Jodoin & Gierl; ELA = English language arts. | ||||||||||
| * Effect-size measure. | ||||||||||
Appendix A includes plots labeled by the item ID, which display the best-fitting regression line for each sub-group, with jitter plots representing the total linkage levels mastered for individuals in each sub-group. Plots are included for the one combinations with a non-negligible effect-size change in the uniform DIF model (Table 9.15), as well as the six combinations with non-negligible effect-size changes in the combined model (Table 9.18).
9.3.1.3 Test Development Team Review of Flagged Items
The test development teams for each subject were provided with data files that listed all items flagged with a moderate effect size. To avoid biasing the review of items, these files did not indicate which group was favored.
During their review of the flagged items, test development teams were asked to consider facets of each item that may lead one gender group to provide correct responses at a higher rate than the other. Because DIF is closely related to issues of fairness, the bias and sensitivity external review criteria (see Clark, Beitling, et al., 2016) were provided for the test development teams to consider as they reviewed the items. After reviewing a flagged item and considering its context in the testlet, including the ELA text or the engagement activity in mathematics, test development teams were asked to provide one of three decision codes for each item.
- Accept: There is no evidence of bias favoring one group or the other. Leave item as is.
- Minor revision: There is a clear indication that a fix will correct the item if the edit can be made within the allowable edit guidelines.
- Reject: There is evidence the item favors one gender group over the other. There is no allowable edit to correct the issue. The item is slated for retirement.
After review, all ELA items flagged with a moderate effect size were given a decision code of 1 by the test development teams. Two mathematics items were given a decision code of 3 and retired, while the three remaining mathematics items flagged with a moderate effect size were given a decision code of 1. No evidence could be found in any of the items with a decision code of 1 indicating the content favored one gender group over the other.
As additional data are collected in subsequent operational years, the scope of DIF analyses will be expanded to include additional items and approaches to detecting DIF.
9.3.2 Internal Structure Within Linkage Levels
Internal structure traditionally indicates the relationships among items measuring the construct of interest. However, for DLM assessments, the level of scoring is each linkage level, and all items measuring the linkage level are assumed to be fungible. Therefore, DLM assessments instead present evidence of internal structure across linkage levels, rather than across items. Further, traditional evidence, such as item-total correlations, are not presented because DLM assessment results consist of the set of mastered linkage levels, rather than a scaled score or raw total score.
Chapter 5 of this manual includes a summary of the parameters used to score the assessment, which includes the probability of a master providing a correct response to items measuring the linkage level and the probability of a non-master providing a correct response to items measuring the linkage level. Because a fungible model is used for scoring, these parameters are the same for all items measuring the linkage level. Chapter 5 also provides a description of the linkage level discrimination (i.e., the ability to differentiate between masters and non-masters).
When linkage levels perform as expected, masters should have a high probability of providing a correct response, and non-masters should have a low probability of providing a correct response. As indicated in Chapter 5 of this manual, for 838 (97%) linkage levels, masters had a greater than .5 chance of providing a correct response to items. Additionally, for 801 (93%) linkage levels, masters had a greater than .6 chance of providing a correct response, compared to only 9 (1%) linkage levels where masters had a less than .4 chance of providing a correct response. Similarly, for 722 (84%) linkage levels, non-masters had a less than .5 chance of providing a correct response to items. For most linkage levels (n = 548; 64%) non-masters had a less than .4 chance of providing a correct response; however, for 53 (6%) linkage levels, non-masters had a greater than .6 chance of providing a correct response. Finally, 628 (73%) linkage levels had discrimination index of greater than .4, indicating that most linkage levels are able to discriminate well between masters and non-masters.
Chapter 3 of this manual includes additional evidence of internal consistency in the form of standardized difference figures. Standardized difference values are calculated to indicate how far from the linkage level mean each item’s p-value falls. Across all linkage levels, 312 (99%) of items fell within two standard deviations of the mean for the linkage level.
These sources, combined with procedural evidence for developing fungible testlets at the linkage level, provide evidence of the consistency of measurement at the linkage levels. For more information on the development of fungible testlets, see the 2014–2015 Technical Manual—Year-End Model (Dynamic Learning Maps Consortium, 2016b). In instances where linkage levels and the items measuring them do not perform as expected, test development teams review flags and prioritize content for revision and re-field test, or retirement, to ensure the content measures the construct as expected.
9.4 Conclusion
This chapter presents additional studies as evidence for the overall validity argument for the DLM Alternate Assessment System. The studies are organized into categories where available (content, response process, internal structure, and relation to other variables), as defined by the Standards for Educational and Psychological Testing (American Educational Research Association et al., 2014), the professional standards used to evaluate educational assessments.
The final chapter of this manual, Chapter 11, references evidence presented through the technical manual, including Chapter 9, and expands the discussion of the overall validity argument. Chapter 11 also provides areas for further inquiry and ongoing evaluation of the DLM Alternate Assessment System, building on the evidence presented in the 2014–2015 Technical Manual—Year-End Model (Dynamic Learning Maps Consortium, 2016b) and the subsequent annual technical manual updates (Dynamic Learning Maps Consortium, 2017b, 2017c, 2018, 2019b), in support of the assessment’s validity argument.